Market Synopsis
The global green solvents market was valued at USD 2,093.22 million in 2024 and is projected to reach USD 4,036.80 million by 2032, growing at a strong CAGR of 8.60%. The market is is experiencing robust expansion due to the increasing demand for sustainable and eco-friendly alternatives to conventional petrochemical solvents. Growing regulatory pressure from governments and international bodies to curb volatile organic compound (VOC) emissions and reduce carbon footprints is one of the strongest growth drivers. Industries such as paints & coatings, personal care, pharmaceuticals, and agrochemicals are rapidly shifting toward bio-based and renewable solvents derived from plant-based feedstocks, agricultural waste, and algae. Rising consumer awareness about the environmental and health hazards of chemical solvents is also creating strong market pull, particularly in developed economies with stricter sustainability targets.
Furthermore, the market outlook is strengthened by advances in biotechnology and green chemistry, which are enabling cost-effective production and improved performance of bio-based solvents. The integration of circular economy models, such as waste-to-solvent technologies and industrial by-product utilization, is expanding opportunities across industries. Additionally, global corporations are aligning with sustainability and ESG (Environmental, Social, and Governance) goals, driving adoption of green solvents in manufacturing processes and supply chains. These combined factors are positioning the green solvents market for sustained long-term growth, with innovation and regulatory compliance acting as twin pillars supporting its expansion.
Global Green Solvents Market (USD Million)

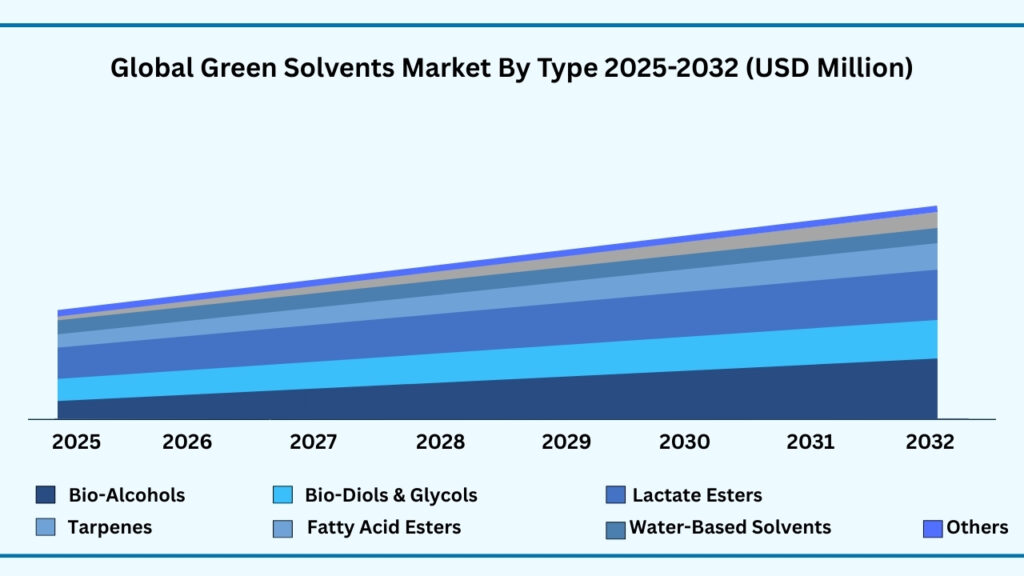
Global green solvents Market By Type Insights:
Lactate Esters segment accounted for market share of share 30.89% in 2024 in the global green solvents market.
The Lactate Esters segment accounted for the largest share of the global green solvents market in 2024, representing 30.89% of total revenues. Lactate Esters segment is expected to register a CAGR of 8.60 % during the forecast year from 2025 to 2032 and expected to reach USD 1,246.97 million in 2032.
Global Green Solvents Market By Type (USD Million)
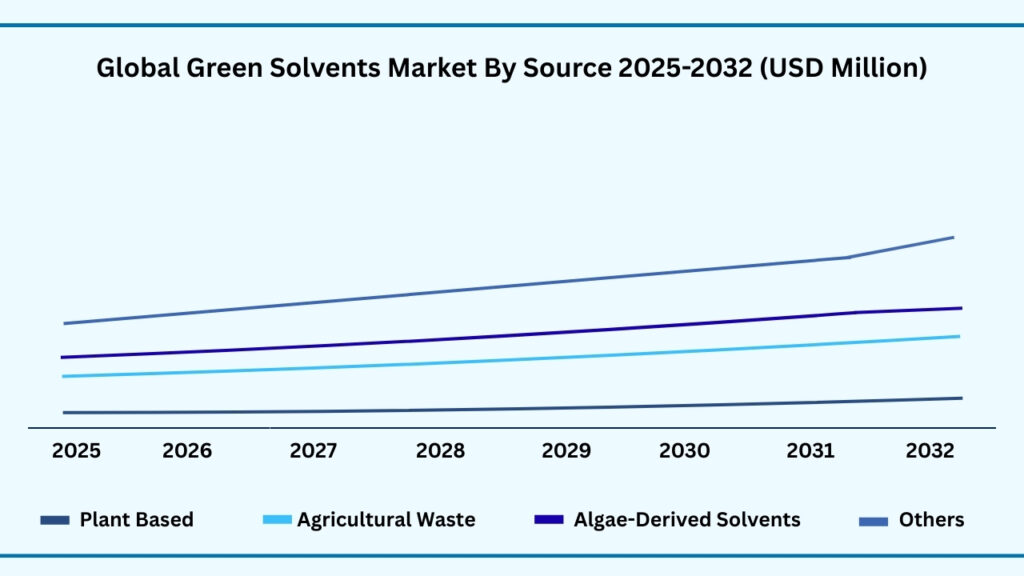
Global Green Solvents Maret by Source Insights:
Plant-Based segment accounted for the largest market share of share 42.32% in 2024 in the global green solvents market.
Based on the source, plant-based segment held the largest revenue share of 42.32% in 2024, and expected to register a CAGR of 9.00% between 2025 to 2032 and the market is expected to reach USD 1,753.59 million by 2032. This is primarily due to the abundance of renewable raw materials and growing preference for bio-based, non-toxic, and biodegradable alternatives to petrochemical solvents. Rising concerns over environmental sustainability, stricter VOC emission norms, and consumer demand for clean-label, eco-friendly products have accelerated adoption across industries such as pharmaceuticals, personal care & cosmetics, paints & coatings, and food processing. Plant-derived solvents, such as bio-ethanol, bio-butanol, terpenes, and lactate esters, are increasingly valued for their versatility, lower toxicity, and compatibility with green chemistry principles, making them a preferred choice for both manufacturers and end-users.
This growth will be driven by advancements in agricultural biotechnology and fermentation technologies that are improving yield efficiency and reducing production costs. The integration of sustainable sourcing practices, combined with investments in circular economy models, is further boosting scalability. Moreover, the rising focus on ESG compliance and increasing collaborations between chemical producers, biofuel companies, and biotech firms are expected to accelerate commercialization and innovation in plant-based solvents, cementing their position as the leading source in the global green solvents market.
Global Green Solvents Market By Source (USD Million)
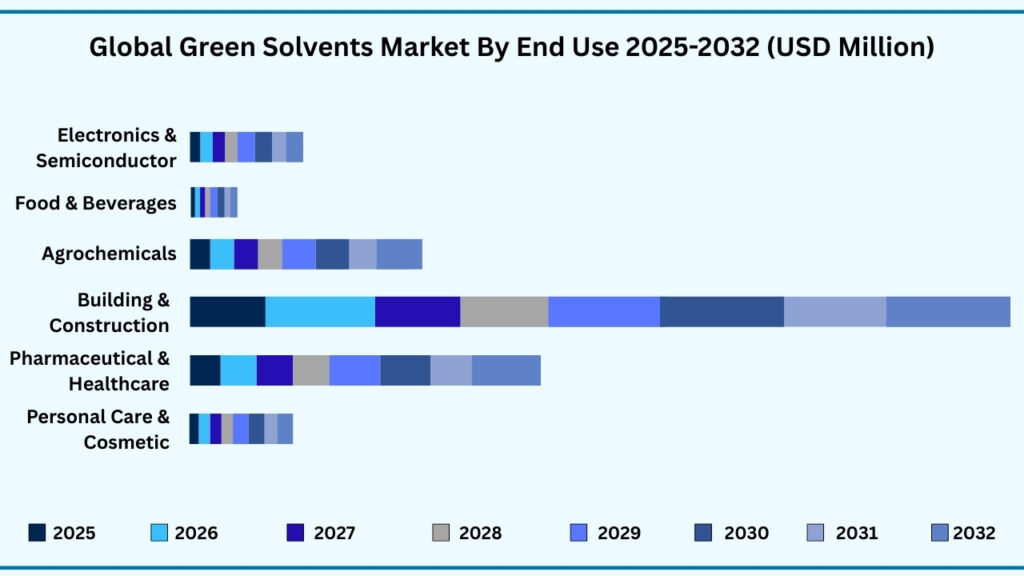
Global Green Solvents Maret by End Use Insights:
Building & Construction segment accounted for the largest market share of share 65.32% in 2024 in the global green solvents market.
Based on end use, 65.32%segment held the largest revenue share of 65.32% in the global green solvents market market in 2024 and expected to register a CAGR of 8.60% from 2025 to 2032 and expected to reach USD 2,663.89 million. The dominance of the largest end-use segment in the green solvents market is underpinned by its widespread adoption across industries where sustainability, safety, and regulatory compliance are top priorities. Growing concerns over the environmental and health impacts of petrochemical solvents are driving industries such as pharmaceuticals, personal care, food & beverages, and coatings to transition toward bio-based, low-toxicity alternatives. Green solvents are increasingly valued not only for their ability to reduce volatile organic compound emissions but also for their role in improving worker safety and aligning with clean-label and eco-conscious consumer demands. Their compatibility with diverse applications, from drug formulation and cosmetics production to food processing and packaging, ensures their strong presence in critical, high-demand industries.
Looking ahead, this segment is expected to sustain its leading position due to the convergence of regulatory pressure, technological advancements, and rising consumer expectations for sustainable products. Industries are investing heavily in green chemistry innovations and renewable feedstocks to ensure efficiency while minimizing their ecological footprint. Additionally, cross-industry collaborations and research partnerships are expanding the functional range of bio-based solvents, enabling their integration into processes that traditionally relied on petrochemicals. As global supply chains continue to emphasize ESG compliance and circular economy principles, the largest end-use segment is poised to benefit significantly, reinforcing its role as a cornerstone of the green solvents market’s long-term growth trajectory.
Global Green Solvents Market By End Use (USD Million)
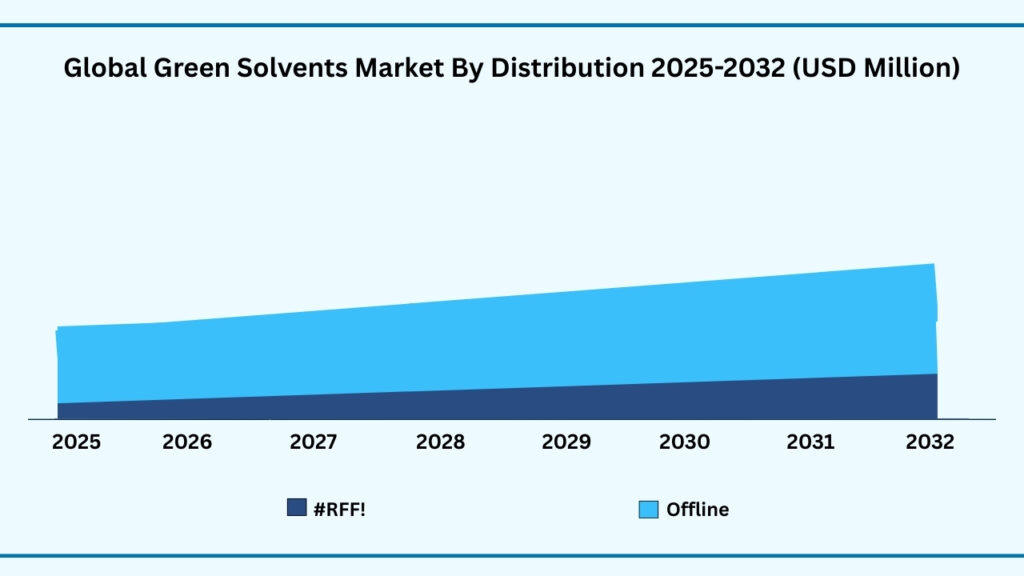
Global Green Solvents Market by Distribution Channel Insights:
Offline segment accounted for the largest market share of share of 80.79% in 2024 in the global green solvents market.
Based on distribution channel, offline segment held the largest revenue share of 80.79% in the global green solvents market in 2024 and expected to register a CAGR of 8.59% from 2024 to 2032 and expected to reach USD 3,269.41 million in 2032. The offline segment leads the global green solvents market largely due to the entrenched role of traditional distribution networks, which remain the primary channel for bulk purchases and industrial supply. Large-scale buyers such as chemical manufacturers, pharmaceutical companies, and coatings producers prefer direct procurement through distributors, wholesalers, and specialty chemical retailers because it ensures product availability, reliability, and logistical support. Offline channels also provide buyers with the advantage of personal interaction, technical consultation, and bulk order customization, which are crucial when sourcing green solvents for specialized industrial applications. The trust and long-term relationships built through offline distribution further reinforce its dominance, as clients often rely on established partners for consistent quality and after-sales support.
Another key factor driving the strength of the offline segment is its capacity to manage regulatory compliance and technical certification requirements. Green solvents, often used in highly regulated industries like healthcare, food, and personal care, require strict quality assurance, testing, and documentation. Offline distributors are better equipped to handle these needs by offering certified products, guidance on safe handling, and tailored solutions for end-use industries. Moreover, offline networks play a critical role in introducing innovative formulations and educating buyers on the advantages of green solvents, enabling faster adoption. As industrial demand grows and sustainability mandates strengthen, the offline segment continues to be the preferred channel for businesses seeking reliability, compliance, and personalized service.
Global Green Solvents By Distribution Channel (USD Million)
Global Green Solvents Market by Region Insights:
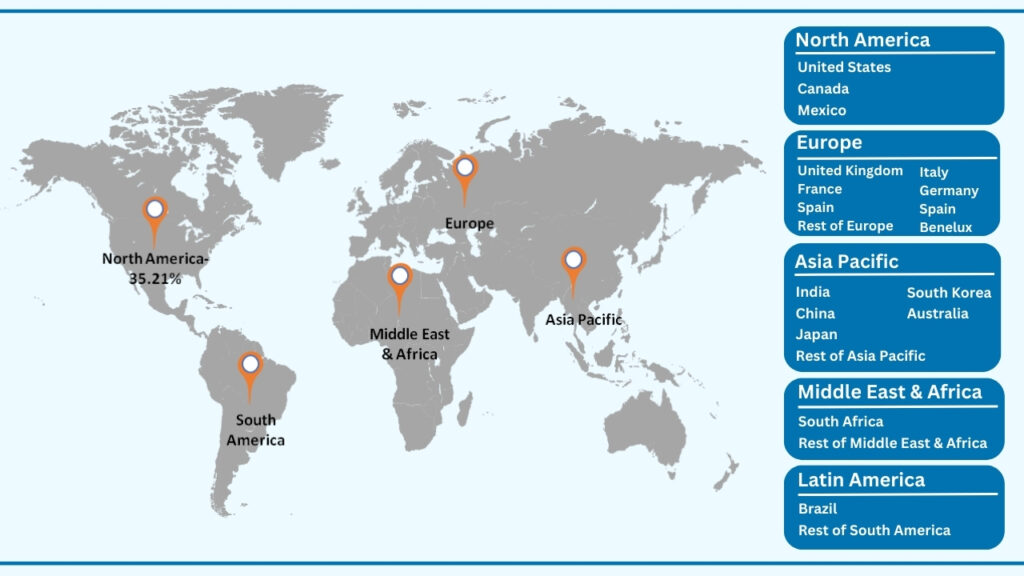
North America segment accounted for the largest market share of share of 35.21% in 2024 in the global green solvents market.
Based on region, the global Green Solvents market is segmented into Europe, Asia-Pacific, North America, Latin America and Middle East & Africa. Among these, North America region held the largest revenue share of 35.21% in the global Green Solvents market in 2024 and expected to register a CAGR of 8.59% from 2024 to 2032 and expected to reach USD 1,420.55 million in 2032. North America dominates the global green solvents market primarily due to its strong emphasis on sustainability, stringent environmental regulations, and early adoption of eco-friendly technologies. Governments and regulatory bodies in the region, such as the U.S. Environmental Protection Agency (EPA) and Canada’s environmental agencies, have implemented strict guidelines on reducing volatile organic compounds (VOCs) and hazardous chemicals. This regulatory push has accelerated the demand for bio-based and renewable solvents in industries such as paints and coatings, pharmaceuticals, personal care, and cleaning products. In addition, the region benefits from a well-established industrial base, advanced R&D infrastructure, and strong consumer awareness around green chemistry, which collectively strengthen the market presence of North America.
The region’s leadership is also reinforced by the presence of key global players and innovative startups actively investing in green solvent technologies. Collaboration between academic institutions, private companies, and government agencies drives continuous innovation and commercialization of next-generation bio-based solvents. Moreover, rising demand from end-use industries such as automotive, construction, and healthcare adds further momentum to market growth. Strong distribution networks, widespread industrial adoption, and increasing investment in sustainable raw materials such as plant-based feedstocks ensure that North America remains a pivotal hub for green solvents in the global landscape.
Global Green Solvnets Market By Region (USD Million)
Major Companies and Competitive Landscape
he global green solvents market is highly fragmented, featuring a diverse mix of multinational chemical corporations, specialized bio-based solution providers, and innovative startups. Leading players are actively pursuing strategies such as mergers and acquisitions, joint ventures, and strategic collaborations with raw material suppliers and end-use industries to strengthen their market position. Companies are also investing in expanding production capacities and developing advanced bio-based formulations to meet the evolving needs of industries such as paints and coatings, pharmaceuticals, personal care, and industrial cleaning. These efforts are primarily directed toward improving efficiency, reducing costs, and scaling production while maintaining high environmental standards.
In addition, market leaders are placing a strong emphasis on sustainability and circular economy principles. They are adopting renewable feedstocks, reducing carbon emissions in production processes, and ensuring compliance with stringent environmental regulations. Transparent sourcing, eco-label certifications, and green chemistry initiatives are also becoming central to competitive positioning. The growing demand from environmentally conscious consumers and industries is pushing players to differentiate their portfolios with innovative, low-toxicity, and biodegradable solvent solutions. This focus on R&D, coupled with premiumization strategies and global distribution network expansion, is expected to drive competitive intensity and accelerate adoption of green solvents worldwide.
Some of the leading companies profiled in the global Green Solvents market report include:
- BASF
- Dow Chemical
- DuPont
- Solvay
- Arkema
- Novozymes
- Clariant
- Evonik
- Mitsubishi Chemical Holdings Corporation
- DSM (Koninklijke DSM N.V.)
Strategic Development
Evonik
In 2024 Evonik launched a pair of new biosurfactants, TEGO Wet 570 Terra and TEGO Wet 580 Terra, produced via fermentation; these are intended for use in coatings and inks, with very low VOC levels and enhanced biodegradability
Scope of Research
| Report Details | Outcome |
|---|---|
| Market size in 2024 | USD 2,093.22 Million |
| CAGR (2024–2032) | 8.60% |
| Revenue forecast to 2033 | USD 4,036.80 Million |
| Base year for estimation | 2024 |
| Historical data | 2019–2023 |
| Forecast period | 2025–2032 |
| Quantitative units | Revenue in USD Million, and CAGR in % from 2025 to 2032 |
| Report coverage | Revenue forecast, company ranking, competitive landscape, growth factors, and trends |
| Segments covered | By Ingredient, By Product Form, By Type, By Source, By Distribution Channel, By End Use and By region |
| Regional scope | North America, Europe, Asia Pacific, Latin America, Middle East & Africa |
| Country scope | U.S., Canada, Mexico, Germany, France, U.K., Italy, Spain, Benelux, Russia, Finland, Sweden, Rest of Europe, China, India, Japan, South Korea, Indonesia, Thailand, Vietnam, Australia, New Zealand Rest of APAC, Brazil, Rest of LATAM, Saudi Arabia, Rest of MEA |
| Key companies profiled | BASF, Dow Chemical, DuPont, Solvay, Arkema, Novozymes, Clariant, Evonik, Mitsubishi Chemical Holdings Corporation, DSM (Koninklijke DSM N.V.), Burt’s Bees, Cargill, Incorporated ADM (Archer Daniels Midland Company), InKemia Green Chemicals, Inc., BioLogiQ, Inc.Dr., GFBiochemicals Ltd., Plantic Technologies Limited, VertecBioSolvents Inc., Conagen, Inc.,Global Green Chemicals Public Company Limited, 12.21. Impact Nano |
| Customization scope | 10 hours of free customization and expert consultation |
Some Key Questions the Report Will Answer
- What is the expected revenue Compound Annual Growth Rate (CAGR) of the global Green Solvents market over the forecast period (2025–2032)?
- The global Green Solvents market revenue is expected to register a Compound Annual Growth Rate (CAGR) of 8.60% during the forecast period.
- What was the size of the global Green Solvents in 2024?
- The global alkyl amines market size was USD 4,036.80 Million in 2024.
- Which factors are expected to drive the global Green Solvents market growth?
- The growth of the global Green Solvents market is expected to be driven by increasing environmental regulations that restrict the use of hazardous petrochemical solvents, coupled with rising demand for eco-friendly and biodegradable alternatives across industries. Growing awareness of sustainability among manufacturers and consumers, along with the push for low-VOC formulations in paints, coatings, adhesives, and cleaning products, is further boosting adoption. In addition, technological advancements in bio-based production, government incentives promoting green chemistry, and the rising preference for plant-based raw materials are creating strong momentum for the market’s expansion.
- Which was the leading segment in the global Green Solvents market in terms of type in 2024?
- In 2024, the lactate esters segment held the largest share of the global Green Solvents market, primarily due to their exceptional biodegradability, low toxicity, and effectiveness as replacements for conventional petrochemical-based solvents. Derived from renewable resources such as corn starch and sugarcane, lactate esters are widely used in applications including paints and coatings, cleaners, inks, and personal care products. Their strong solvency power, coupled with compliance to stringent environmental and workplace safety regulations, has made them highly attractive to industries seeking sustainable alternatives. Growing demand for eco-friendly formulations and increasing regulatory pressure to reduce volatile organic compounds (VOCs) further strengthened the dominance of the lactate esters segment.
- What are some restraints for revenue growth of the global Green Solvents market?
- One of the key restraints for the revenue growth of the global Green Solvents market is the high production cost compared to conventional petrochemical-based solvents, which limits large-scale adoption, especially in price-sensitive industries. In addition, limited performance compatibility in certain applications, such as industrial-scale manufacturing or specialized formulations, restricts their substitution potential. Challenges in raw material availability, scalability of bio-based feedstocks, and lack of widespread infrastructure for green chemistry also hinder rapid expansion. Moreover, fluctuating agricultural input prices and competition from well-established synthetic solvents further act as barriers to market growth.
Follow us on: Facebook, Twitter, Instagram and LinkedIn.
Chapter 1. Introduction
1.1. Market Definition
1.2. Objectives of the study
1.3. Overview of Green Solvents Market
1.4. Currency and pricing
1.5. Limitation
1.6. Markets covered
1.7. Research Scope
Chapter 2. Research Methodology
2.1. Research Sources
2.1.1.Primary
2.1.2.Secondary
2.1.3.Paid Sources
2.2. Years considered for the study
2.3. Assumptions
2.3.1.Market value
2.3.2.Market volume
2.3.3.Exchange rate
2.3.4.Price
2.3.5.Economic & political stability
Chapter 3. Executive Summary
3.1. Summary Snapshot, 2019–2032
Chapter 4. Key Insights
4.1. Production consumption analysis
4.2. Strategic partnerships & alliances
4.3. Joint ventures
4.4. Acquisition of local players
4.5. Contract manufacturing
4.6. Digital & e-commerce sales channels
4.7. Compliance with standards
4.8. Value chain analysis
4.9. Raw material sourcing
4.10. Formulation & manufacturing4.11.Distribution & retail
4.12. Import-export analysis
4.13. Brand comparative analysis
4.14. Technological advancements
4.15. Porter’s five force
4.15.1. Threat of new entrants
4.15.1.1. Capital requirment
4.15.1.2. Product knowledge
4.15.1.3. Technical knowledge
4.15.1.4. Customer relation
4.15.1.5. Access to appliation and technology
4.15.2. Threat of substitutes
4.15.2.1. Cost
4.15.2.2. Performance
4.15.2.3. Availability
4.15.2.4. Technical knowledge
4.15.2.5. Durability
4.15.3. Bargainning power of buyers
4.15.3.1. Numbers of buyers relative to suppliers
4.15.3.2. Product differentiation
4.15.3.3. Threat of forward integration
4.15.3.4. Buyers volume
4.15.4. Bargainning power of suppliers
4.15.4.1. Suppliers concentration
4.15.4.2. Buyers switching cost to other suppliers
4.15.4.3. Threat of backward integration
4.15.5. Bargainning power of suppliers
4.15.5.1. Industry concentration
4.15.5.2. Industry growth rate
4.15.5.3. Product differentiation
4.16. Patent analysis
4.17. Regulation coverage
4.18. Pricing analysis
4.19. Competitive Metric Space Analysis
Chapter 5. Market Overview
5.1. Drivers
5.1.1.Environmental Regulations and Sustainability Initiatives
5.1.2.Growing Awareness of Health and Safety
5.1.3.Rising Adoption in Key Industries
5.2. Restraints
5.2.1.Higher Production Costs
5.2.2.Limited Availability of Feedstock
5.3. Opportunities
5.3.1.Innovation in Bio-Based and Circular Economy Solutions
5.3.2.Expansion into Emerging Markets
5.3.3.Strategic Partnerships and Collaborations
5.4. Challenges
5.4.1.Performance Limitations Compared to Conventional Solvents
5.4.2.Lack of Standardization and Certifications
Chapter 6. Global Green Solvents Market By Type Insights & Trends, Revenue (USD Million),
Volume (Kiloton)
6.1. Type Dynamics & Market Share, 2019–2032
6.1.1.1. Bio-Alcohols
6.1.1.1.1. Ethanol
6.1.1.1.2. Butanol
6.1.1.1.3. Propanol
6.1.1.1.4. Isopropanol
6.1.1.2. Bio-Diols & Glycols
6.1.1.2.1. Propylene glycol
6.1.1.2.2. Butylene glycol
6.1.1.3. Lactate Esters
6.1.1.3.1. Ethyl lactate
6.1.1.3.2. Butyl lactate
6.1.1.4. Tarpenes
6.1.1.4.1. D-Limonene
6.1.1.4.2. Pinene
6.1.1.5. Fatty Acid Esters
6.1.1.5.1. Methyl soyate
6.1.1.5.2. Ethyl oleate
6.1.1.6. Water-Based Solvents
6.1.1.6.1. Non-ionic surfactants
6.1.1.6.2. Anionic surfactants
6.1.1.6.3. Cationic surfactants
6.1.1.7. Others
Chapter 7. Global Green Solvents Market By Source Insights & Trends, Revenue (USD Million),
Volume (Kiloton)
7.1. Source Dynamics & Market Share, 2019–2032
7.1.1. Plant-Based
7.1.1.1. Soybean oil derivatives
7.1.1.2. Corn-based alcohols
7.1.1.3. Citrus peel extracts
7.1.1.4. Sugar-derived solvents
7.1.2. Agricultural Waste
7.1.2.1. Corn husks
7.1.2.2. Rice bran oil
7.1.2.3. Coconut shells
7.1.2.4. Sugarcane bagasse
7.1.2.5. Wheat straw
7.1.3. Algae-Derived Solvents
7.1.3.1. Microalgae lipid
7.1.3.2. Marine algae bio-oils
7.1.3.3. Omega-rich solvent
7.1.4. Bioengineered
7.1.4.1. Bio-butanol
7.1.4.2. Bio-propylene glycol
7.1.4.3. Bio-succinic acid
7.1.5. Other
Chapter 8. Global Green Solvents Market By End Use Insights & Trends, Revenue (USD Million),
Volume (Kiloton)
8.1. End Use Dynamics & Market Share, 2019–2032
8.1.1.Personal Care & Cosmetics
8.1.1.1. Skincare
8.1.1.1.1. Creams
8.1.1.1.2. Lotions
8.1.1.1.3. Gels
8.1.1.1.4. Serums
8.1.1.1.5. Others
8.1.1.2. Hair Care
8.1.1.2.1. Shampoos
8.1.1.2.2. Conditioners
8.1.1.2.3. hair oils
8.1.1.2.4. Other
8.1.1.3. Makeup
8.1.1.3.1. Foundations
8.1.1.3.2. Primers
8.1.1.3.3. Concealers
8.1.1.3.4. antioxidants
8.1.1.3.5.Other
8.1.2.Pharmaceuticals & Healthcare
8.1.2.1. Drug Formulations
8.1.2.2. Vaccines & Biologics
8.1.2.3. Medical Devices & Diagnostics
8.1.3.Building & Construction
8.1.3.1. Architectural Coatings
8.1.3.1.1. Wall paints and primers
8.1.3.1.2. Waterproofing formulations
8.1.3.1.3. Anti-corrosion coatings
8.1.3.2. Industrial Coatings
8.1.3.2.1. Automotive paints
8.1.3.2.2. Protective coatings for machinery
8.1.3.2.3. Anti-fouling marine coatings
8.1.3.3. Printing Inks
8.1.3.3.1. Packaging inks
8.1.3.3.2. Textile printing formulations
8.1.3.3.3. Conductive inks for electronics
8.1.4. Agrochemicals
8.1.4.1. Pesticides & Herbicides
8.1.4.1.1. Solubilizers
8.1.4.1.2. Adjuvants
8.1.4.2. Fertilizers
8.1.4.2.1. nutrient blends
8.1.4.2.2. Adjuvants Chelating agents
8.1.4.3. Seed Treatment
8.1.4.3.1. seed coatings
8.1.4.3.2. Fungicidal and insecticidal carriers
8.1.4.3.3. Enhanced nutrient uptake agents
8.1.5. Food & Beverages
8.1.5.1. Extraction of Natural Ingredients
8.1.5.1.1. Essential oils
8.1.5.1.2. Flavors
8.1.5.1.3. colors
8.1.5.2. Beverage Formulations
8.1.5.2.1. Solubilizers
8.1.5.2.2. Carriers for vitamins and supplements
8.1.5.2.3. Stabilizers in emulsions and syrups
8.1.5.3. Food Preservation
8.1.5.3.1. Antimicrobial agents
8.1.5.3.2. Moisture retention enhancers
8.1.5.3.3. Packaging adhesives
8.1.6.Electronics & Semiconductors
8.1.6.1. Printed Circuit Board (PCB) Cleaning
8.1.6.1.1. Removal of flux residues
8.1.6.1.2. Surface preparation solvents
8.1.6.1.3. High-purity cleaning agents
8.1.6.1.4. Others
8.1.6.2. Semiconductor Processing
8.1.6.2.1. Photoresist stripping solvents
8.1.6.2.2. Dielectric cleaning formulations
8.1.6.2.3. Solvent carriers for doping agents
8.1.6.2.4. Others
8.1.6.3. Battery Manufacturing
8.1.6.3.1. Electrolyte formulations
8.1.6.3.2. Solvent carriers for active materials
8.1.6.3.3. Stabilizers in lithium-based batteries
8.1.6.4. Others
Chapter 9. Global Green Solvents Market By Distribution Channel Insights & Trends, Revenue
(USD Million), Volume (Kiloton)
9.1. Source Dynamics & Market Share, 2019–2032
9.1.1. Offline
9.1.1.1. Distributors / Wholesalers
9.1.1.2. Retail Stores
9.1.1.3. Trade Fairs / Exhibitions / Conferences
9.1.2. Online
9.1.2.1. E-Commerce Platforms
9.1.2.2. Manufacturer Websites
9.1.2.3. Social Media & Influencer Marketing
9.1.2.4. Digital B2B Marketplaces
Chapter 10. Global Green Solvents Market Regional Outlook, Revenue (USD Million), Volume
(Kiloton)
10.1. Green Solvents Share By Region, 2019–2032
10.2. North America
10.2.1. Market By Type Estimates and Forecast, USD Million, Volume (Kiloton)
2019-2032
10.2.1.1. Bio-Alcohols
10.2.1.1.1. Ethanol
10.2.1.1.2. Butanol
10.2.1.1.3. Propanol
10.2.1.1.4. Isopropanol
10.2.1.2. Bio-Diols & Glycols
10.2.1.2.1. Propylene glycol
10.2.1.2.2. Butylene glycol
10.2.1.3. Lactate Esters
10.2.1.3.1. Ethyl lactate
10.2.1.3.2. Butyl lactate
10.2.1.4. Tarpenes
10.2.1.4.1. D-Limonene
10.2.1.4.2. Pinene
10.2.1.5. Fatty Acid Esters
10.2.1.5.1. Methyl soyate
10.2.1.5.2. Ethyl oleate
10.2.1.6. Water-Based Solvents
10.2.1.6.1. Non-ionic surfactants
10.2.1.6.2. Anionic surfactants
10.2.1.6.3. Cationic surfactants
10.2.1.7. Others
10.2.2. Market By Source, Market Estimates and Forecast, USD Million, Volume
(Kiloton) 2019-2032
10.2.3. Plant-Based
10.2.3.1. Soybean oil derivatives
10.2.3.2. Corn-based alcohols
10.2.3.3. Citrus peel extracts
10.2.3.4. Sugar-derived solvents
10.2.4. Agricultural Waste
10.2.4.1. Corn husks
10.2.4.2. Rice bran oil
10.2.4.3. Coconut shells
10.2.4.4. Sugarcane bagasse
10.2.4.5. Wheat straw
10.2.5. Algae-Derived Solvents
10.2.5.1. Microalgae lipid
10.2.5.2. Marine algae bio-oils
10.2.5.3. Omega-rich solvent
10.2.6. Algae-Derived Solvents
10.2.6.1. Microalgae lipid
10.2.6.2. Marine algae bio-oils
10.2.6.3. Omega-rich solvent
10.2.7. Bioengineered
10.2.7.1. Bio-butanol
10.2.7.2. Bio-propylene glycol
10.2.7.3. Bio-succinic acid
10.2.8. Other
10.2.9. Market By End Use, Market Estimates and Forecast, USD Million, Volume
(Kiloton) 2019-2032
10.2.10.
10.2.11. Personal Care & Cosmetics
10.2.11.1. Skincare
10.2.11.1.1. Creams
10.2.11.1.2. Lotions
10.2.11.1.3. Gels
10.2.11.1.4. Serums
10.2.11.1.5. Others
10.2.11.2. Hair Care
10.2.11.2.1. Shampoos
10.2.11.2.2. Conditioners
10.2.11.2.3. hair oils
10.2.11.2.4. Other
10.2.11.3. Makeup
10.2.11.3.1. Foundations
10.2.11.3.2. Primers
10.2.11.3.3. Concealers
10.2.11.3.4. antioxidants
10.2.11.3.5. Other
10.2.12. Pharmaceuticals & Healthcare
10.2.12.1. Drug Formulations
10.2.12.2. Vaccines & Biologics
10.2.12.3. Medical Devices & Diagnostics
10.2.13. Building & Construction
10.2.13.1. Architectural Coatings
10.2.13.1.1. Wall paints and primers
10.2.13.1.2. Waterproofing formulations
10.2.13.1.3. Anti-corrosion coatings
10.2.13.2. Industrial Coatings
10.2.13.2.1. Automotive paints
10.2.13.2.2. Protective coatings for machinery
10.2.13.2.3. Anti-fouling marine coatings
10.2.13.3. Printing Inks
10.2.13.3.1. Packaging inks
10.2.13.3.2. Textile printing formulations
10.2.13.3.3. Conductive inks for electronics
10.2.14. Agrochemicals
10.2.14.1.Pesticides & Herbicides
10.2.14.1.1. Solubilizers
10.2.14.1.2. Adjuvants
10.2.14.2. Fertilizers
10.2.14.2.1. nutrient blends
10.2.14.2.2. Adjuvants Chelating agents
10.2.14.3. Seed Treatment
10.2.14.3.1. seed coatings
10.2.14.3.2. Fungicidal and insecticidal carriers
10.2.14.3.3. Enhanced nutrient uptake agents
10.2.15. Food & Beverages
10.2.15.1. Extraction of Natural Ingredients
10.2.15.1.1. Essential oils
10.2.15.1.2. Flavors
10.2.15.1.3. colors
10.2.15.2. Beverage Formulations
10.2.15.2.1. Solubilizers
10.2.15.2.2. Carriers for vitamins and supplements
10.2.15.2.3. Stabilizers in emulsions and syrups
10.2.15.3. Food Preservation
10.2.15.3.1. Antimicrobial agents
10.2.15.3.2. Moisture retention enhancers
10.2.15.3.3. Packaging adhesives
10.2.16. Electronics & Semiconductors
10.2.16.1. Printed Circuit Board (PCB) Cleaning
10.2.16.1.1. Removal of flux residues
10.2.16.1.2. Surface preparation solvents
10.2.16.1.3. High-purity cleaning agents
10.2.16.1.4. Others
10.2.16.2. Semiconductor Processing
10.2.16.2.1. Photoresist stripping solvents
10.2.16.2.2. Dielectric cleaning formulations
10.2.16.2.3. Solvent carriers for doping agents
10.2.16.2.4. Others
10.2.16.3. Battery Manufacturing
10.2.16.3.1. Electrolyte formulations
10.2.16.3.2. Solvent carriers for active materials
10.2.16.3.3. Stabilizers in lithium-based batteries
10.2.17. Market By Distribution Channel, Market Estimates and Forecast, USD Million,
Volume (Kiloton) 2019-2032
10.2.18. Offline
10.2.18.1. Distributors / Wholesalers
10.2.18.2. Retail Stores
10.2.18.3. Trade Fairs / Exhibitions / Conferences
10.2.19. Online
10.2.19.1. E-Commerce Platforms
10.2.19.2. Manufacturer Websites
10.2.19.3. Social Media & Influencer Marketing
10.2.19.4. Digital B2B Marketplaces
10.2.20. Market By Country, Market Estimates and Forecast, USD Million,
10.2.20.1. US
10.2.20.2. Canada
10.2.20.3. Mexico
10.3. Europe
10.3.1. Market By Type Estimates and Forecast, USD Million, Volume (Kiloton) 2019-
2032
10.3.1.1. Bio-Alcohols
10.3.1.1.1. Ethanol
10.3.1.1.2. Butanol
10.3.1.1.3. Propanol
10.3.1.1.4. Isopropanol
10.3.1.2. Bio-Diols & Glycols
10.3.1.2.1. Propylene glycol
10.3.1.2.2. Butylene glycol
10.3.1.3. Lactate Esters
10.3.1.3.1. Ethyl lactate
10.3.1.3.2. Butyl lactate
10.3.1.4. Tarpenes
10.3.1.4.1. D-Limonene
10.3.1.4.2. Pinene
10.3.1.5. Fatty Acid Esters
10.3.1.5.1. Methyl soyate
10.3.1.5.2. Ethyl oleate
10.3.1.6. Water-Based Solvents
10.3.1.6.1. Non-ionic surfactants
10.3.1.6.2. Anionic surfactants
10.3.1.6.3. Cationic surfactants
10.3.1.7. Others
10.3.2. Market By Source, Market Estimates and Forecast, USD Million, Volume
(Kiloton) 2019-2032
10.3.3. Plant-Based
10.3.3.1. Soybean oil derivatives
10.3.3.2. Corn-based alcohols
10.3.3.3. Citrus peel extracts
10.3.3.4.Sugar-derived solvents
10.3.4. Agricultural Waste
10.3.4.1. Corn husks
10.3.4.2. Rice bran oil
10.3.4.3. Coconut shells
10.3.4.4. Sugarcane bagasse
10.3.4.5. Wheat straw
10.3.5. Algae-Derived Solvents
10.3.5.1. Microalgae lipid
10.3.5.2. Marine algae bio-oils
10.3.5.3. Omega-rich solvent
10.3.6. Algae-Derived Solvents
10.3.6.1. Microalgae lipid
10.3.6.2. Marine algae bio-oils
10.3.6.3. Omega-rich solvent
10.3.7.Bioengineered
10.3.7.1. Bio-butanol
10.3.7.2. Bio-propylene glycol
10.3.7.3. Bio-succinic acid
10.3.8.Other
10.3.9.Market By End Use, Market Estimates and Forecast, USD Million, Volume
(Kiloton) 2019-2032
10.3.10.
10.3.11. Personal Care & Cosmetics
10.3.11.1. Skincare
10.3.11.1.1. Creams
10.3.11.1.2. Lotions
10.3.11.1.3. Gels
10.3.11.1.4. Serums
10.3.11.1.5. Others
10.3.11.2. Hair Care
10.3.11.2.1. Shampoos
10.3.11.2.2. Conditioners
10.3.11.2.3. hair oils
10.3.11.2.4. Other
10.3.11.3. Makeup
10.3.11.3.1. Foundations
10.3.11.3.2. Primers
10.3.11.3.3. Concealers
10.3.11.3.4. antioxidants
10.3.11.3.5. Other
10.3.12. Pharmaceuticals & Healthcare
10.3.12.1. Drug Formulations
10.3.12.2. Vaccines & Biologics
10.3.12.3. Medical Devices & Diagnostics
10.3.13. Building & Construction
10.3.13.1. Architectural Coatings
10.3.13.1.1. Wall paints and primers
10.3.13.1.2. Waterproofing formulations
10.3.13.1.3. Anti-corrosion coatings
10.3.13.2. Industrial Coatings
10.3.13.2.1. Automotive paints
10.3.13.2.2. Protective coatings for machinery
10.3.13.2.3. Anti-fouling marine coatings
10.3.13.3. Printing Inks
10.3.13.3.1. Packaging inks
10.3.13.3.2. Textile printing formulations
10.3.13.3.3. Conductive inks for electronics
10.3.14. Agrochemicals
10.3.14.1. Pesticides & Herbicides
10.3.14.1.1. Solubilizers
10.3.14.1.2. Adjuvants
10.3.14.2. Fertilizers
10.3.14.2.1. nutrient blends
10.3.14.2.2. Adjuvants Chelating agents
10.3.14.3. Seed Treatment
10.3.14.3.1. seed coatings
10.3.14.3.2. Fungicidal and insecticidal carriers
10.3.14.3.3. Enhanced nutrient uptake agents
10.3.15. Food & Beverages
10.3.15.1. Extraction of Natural Ingredients
10.3.15.1.1. Essential oils
10.3.15.1.2. Flavors
10.3.15.1.3. colors
10.3.15.2. Beverage Formulations
10.3.15.2.1. Solubilizers
10.3.15.2.2. Carriers for vitamins and supplements
10.3.15.2.3. Stabilizers in emulsions and syrups
10.3.15.3. Food Preservation
10.3.15.3.1. Antimicrobial agents
10.3.15.3.2. Moisture retention enhancers
10.3.15.3.3. Packaging adhesives
10.3.16. Electronics & Semiconductors
10.3.16.1. Printed Circuit Board (PCB) Cleaning
10.3.16.1.1. Removal of flux residues
10.3.16.1.2. Surface preparation solvents
10.3.16.1.3. High-purity cleaning agents
10.3.16.1.4. Others
10.3.16.2. Semiconductor Processing
10.3.16.2.1. Photoresist stripping solvents
10.3.16.2.2. Dielectric cleaning formulations
10.3.16.2.3. Solvent carriers for doping agents
10.3.16.2.4. Others
10.3.16.3. Battery Manufacturing
10.3.16.3.1. Electrolyte formulations
10.3.16.3.2. Solvent carriers for active materials
10.3.16.3.3. Stabilizers in lithium-based batteries
10.3.17. Market By Distribution Channel, Market Estimates and Forecast, USD Million,
Volume (Kiloton) 2019-2032
10.3.18. Offline
10.3.18.1. Distributors / Wholesalers
10.3.18.2. Retail Stores
10.3.18.3. Trade Fairs / Exhibitions / Conferences
10.3.19. Online
10.3.19.1. E-Commerce Platforms
10.3.19.2. Manufacturer Websites
10.3.19.3. Social Media & Influencer Marketing
10.3.19.4. Digital B2B Marketplaces
10.3.20. Market By Country, Market Estimates and Forecast, USD Million,
10.3.20.1. Germany
10.3.20.2. France
10.3.20.3. U.K
10.3.20.4. Italy
10.3.20.5. Spain
10.3.20.6. Benelux
10.3.20.7. Russia
10.3.20.8. Finland
10.3.20.9. Sweden
10.3.20.10. Rest Of Europe
10.4. Asia-Pacific
10.4.1. Market By Type Estimates and Forecast, USD Million, Volume (Kiloton)
2019-2032
10.4.1.1. Bio-Alcohols
10.4.1.1.1. Ethanol
10.4.1.1.2. Butanol
10.4.1.1.3. Propanol
10.4.1.1.4. Isopropanol
10.4.1.2. Bio-Diols & Glycols
10.4.1.2.1. Propylene glycol
10.4.1.2.2. Butylene glycol
10.4.1.3. Lactate Esters
10.4.1.3.1. Ethyl lactate
10.4.1.3.2. Butyl lactate
10.4.1.4. Tarpenes
10.4.1.4.1. D-Limonene
10.4.1.4.2. Pinene
10.4.1.5. Fatty Acid Esters
10.4.1.5.1. Methyl soyate
10.4.1.5.2. Ethyl oleate
10.4.1.6. Water-Based Solvents
10.4.1.6.1. Non-ionic surfactants
10.4.1.6.2. Anionic surfactants
10.4.1.6.3. Cationic surfactants
10.4.1.7. Others
10.4.2. Market By Source, Market Estimates and Forecast, USD Million, Volume
(Kiloton) 2019-2032
10.4.3. Plant-Based
10.4.3.1. Soybean oil derivatives
10.4.3.2. Corn-based alcohols
10.4.3.3. Citrus peel extracts
10.4.3.4. Sugar-derived solvents
10.4.4. Agricultural Waste
10.4.4.1. Corn husks
10.4.4.2. Rice bran oil
10.4.4.3. Coconut shells
10.4.4.4. Sugarcane bagasse
10.4.4.5. Wheat straw
10.4.5. Algae-Derived Solvents
10.4.5.1. Microalgae lipid
10.4.5.2. Marine algae bio-oils
10.4.5.3. Omega-rich solvent
10.4.6. Algae-Derived Solvents
10.4.6.1. Microalgae lipid
10.4.6.2. Marine algae bio-oils
10.4.6.3. Omega-rich solvent
10.4.7. Bioengineered
10.4.7.1. Bio-butanol
10.4.7.2. Bio-propylene glycol
10.4.7.3. Bio-succinic acid
10.4.8. Other
10.4.9. Market By End Use, Market Estimates and Forecast, USD Million, Volume
(Kiloton) 2019-2032
10.4.10.
10.4.11. Personal Care & Cosmetics
10.4.11.1. Skincare
10.4.11.1.1. Creams
10.4.11.1.2. Lotions
10.4.11.1.3. Gels
10.4.11.1.4. Serums
10.4.11.1.5.Others
10.4.11.2. Hair Care
10.4.11.2.1. Shampoos
10.4.11.2.2. Conditioners
10.4.11.2.3. hair oils
10.4.11.2.4. Other
10.4.11.3. Makeup
10.4.11.3.1. Foundations
10.4.11.3.2. Primers
10.4.11.3.3. Concealers
10.4.11.3.4. antioxidants
10.4.11.3.5. Other
10.4.12. Pharmaceuticals & Healthcare
10.4.12.1. Drug Formulations
10.4.12.2. Vaccines & Biologics
10.4.12.3. Medical Devices & Diagnostics
10.4.13. Building & Construction
10.4.13.1. Architectural Coatings
10.4.13.1.1. Wall paints and primers
10.4.13.1.2. Waterproofing formulations
10.4.13.1.3. Anti-corrosion coatings
10.4.13.2. Industrial Coatings
10.4.13.2.1. Automotive paints
10.4.13.2.2. Protective coatings for machinery
10.4.13.2.3. Anti-fouling marine coatings
10.4.13.3. Printing Inks
10.4.13.3.1. Packaging inks
10.4.13.3.2. Textile printing formulations
10.4.13.3.3. Conductive inks for electronics
10.4.14. Agrochemicals
10.4.14.1. Pesticides & Herbicides
10.4.14.1.1. Solubilizers
10.4.14.1.2. Adjuvants
10.4.14.2. Fertilizers
10.4.14.2.1. nutrient blends
10.4.14.2.2. Adjuvants Chelating agents
10.4.14.3. Seed Treatment
10.4.14.3.1. seed coatings
10.4.14.3.2. Fungicidal and insecticidal carriers
10.4.14.3.3. Enhanced nutrient uptake agents
10.4.15. Food & Beverages
10.4.15.1. Extraction of Natural Ingredients
10.4.15.1.1. Essential oils
10.4.15.1.2. Flavors
10.4.15.1.3. colors
10.4.15.2. Beverage Formulations
10.4.15.2.1. Solubilizers
10.4.15.2.2. Carriers for vitamins and supplements
10.4.15.2.3. Stabilizers in emulsions and syrups
10.4.15.3. Food Preservation
10.4.15.3.1. Antimicrobial agents
10.4.15.3.2. Moisture retention enhancers
10.4.15.3.3. Packaging adhesives
10.4.16. Electronics & Semiconductors
10.4.16.1. Printed Circuit Board (PCB) Cleaning
10.4.16.1.1. Removal of flux residues
10.4.16.1.2. Surface preparation solvents
10.4.16.1.3. High-purity cleaning agents
10.4.16.1.4. Others
10.4.16.2. Semiconductor Processing
10.4.16.2.1. Photoresist stripping solvents
10.4.16.2.2. Dielectric cleaning formulations
10.4.16.2.3. Solvent carriers for doping agents
10.4.16.2.4. Others
10.4.16.3. Battery Manufacturing
10.4.16.3.1. Electrolyte formulations
10.4.16.3.2. Solvent carriers for active materials
10.4.16.3.3. Stabilizers in lithium-based batteries
10.4.17. Market By Distribution Channel, Market Estimates and Forecast, USD Million,
Volume (Kiloton) 2019-2032
10.4.18. Offline
10.4.18.1. Distributors / Wholesalers
10.4.18.2. Retail Stores
10.4.18.3. Trade Fairs / Exhibitions / Conferences
10.4.19. Online
10.4.19.1. . E-Commerce Platforms
10.4.19.2.. Manufacturer Websites
10.4.19.3. Social Media & Influencer Marketing
10.4.19.4. Digital B2B Marketplaces
10.4.20. Market By Country, Market Estimates and Forecast, USD Million,
10.4.20.1. China
10.4.20.2. India
10.4.20.3. Japan
10.4.20.4. South Korea
10.4.20.5. Indonesia
10.4.20.6. Thailand
10.4.20.7. Vietnam
10.4.20.8. Australia
10.4.20.9. New Zeland
10.4.20.10. Rest of APAC
10.5.Latin-America
10.5.1. Market By Type Estimates and Forecast, USD Million, Volume (Kiloton)
2019-2032
10.5.1.1. Bio-Alcohols
10.5.1.1.1. Ethanol
10.5.1.1.2. Butanol
10.5.1.1.3. Propanol
10.5.1.1.4. Isopropanol
10.5.1.2. Bio-Diols & Glycols
10.5.1.2.1. Propylene glycol
10.5.1.2.2. Butylene glycol
10.5.1.3. Lactate Esters
10.5.1.3.1. Ethyl lactate
10.5.1.3.2. Butyl lactate
10.5.1.4. Tarpenes
10.5.1.4.1. D-Limonene
10.5.1.4.2. Pinene
10.5.1.5. Fatty Acid Esters
10.5.1.5.1. Methyl soyate
10.5.1.5.2. Ethyl oleate
10.5.1.6. Water-Based Solvents
10.5.1.6.1. Non-ionic surfactants
10.5.1.6.2. Anionic surfactants
10.5.1.6.3. Cationic surfactants
10.5.1.7. Others
10.5.2. Market By Source, Market Estimates and Forecast, USD Million, Volume
(Kiloton) 2019-2032
10.5.3. Plant-Based
10.5.3.1. Soybean oil derivatives
10.5.3.2. Corn-based alcohols
10.5.3.3. Citrus peel extracts
10.5.3.4. Sugar-derived solvents
10.5.4. Agricultural Waste
10.5.4.1. Corn husks
10.5.4.2. Rice bran oil
10.5.4.3. Coconut shells
10.5.4.4. Sugarcane bagasse
10.5.4.5. Wheat straw
10.5.5. Algae-Derived Solvents
10.5.5.1. Microalgae lipid
10.5.5.2. Marine algae bio-oils
10.5.5.3. Omega-rich solvent
10.5.6. Algae-Derived Solvents
10.5.6.1. Microalgae lipid
10.5.6.2. Marine algae bio-oils
10.5.6.3. Omega-rich solvent
10.5.7. Bioengineered
10.5.7.1. Bio-butanol
10.5.7.2. Bio-propylene glycol
10.5.7.3. Bio-succinic acid
10.5.8. Other
10.5.9. Market By End Use, Market Estimates and Forecast, USD Million, Volume
(Kiloton) 2019-2032
10.5.10.
10.5.11. Personal Care & Cosmetics
10.5.11.1. Skincare
10.5.11.1.1. Creams
10.5.11.1.2. Lotions
10.5.11.1.3. Gels
10.5.11.1.4. Serums
10.5.11.1.5. Others
10.5.11.2. Hair Care
10.5.11.2.1. Shampoos
10.5.11.2.2. Conditioners
10.5.11.2.3. hair oils
10.5.11.2.4. Other
10.5.11.3. Makeup
10.5.11.3.1. Foundations
10.5.11.3.2. Primers
10.5.11.3.3. Concealers
10.5.11.3.4. antioxidants
10.5.11.3.5. Other
10.5.12. Pharmaceuticals & Healthcare
10.5.12.1. Drug Formulations
10.5.12.2. Vaccines & Biologics
10.5.12.3. Medical Devices & Diagnostics
10.5.13. Building & Construction
10.5.13.1. Architectural Coatings
10.5.13.1.1. Wall paints and primers
10.5.13.1.2. Waterproofing formulations
10.5.13.1.3. Anti-corrosion coatings
10.5.13.2. Industrial Coatings
10.5.13.2.1. Automotive paints
10.5.13.2.2. Protective coatings for machinery
10.5.13.2.3. Anti-fouling marine coatings
10.5.13.3. Printing Inks
10.5.13.3.1. Packaging inks
10.5.13.3.2. Textile printing formulations
10.5.13.3.3. Conductive inks for electronics
10.5.14. Agrochemicals
10.5.14.1. Pesticides & Herbicides
10.5.14.1.1. Solubilizers
10.5.14.1.2. Adjuvants
10.5.14.2. Fertilizers
10.5.14.2.1. nutrient blends
10.5.14.2.2. Adjuvants Chelating agents
10.5.14.3. Seed Treatment
10.5.14.3.1. seed coatings
10.5.14.3.2. Fungicidal and insecticidal carriers
10.5.14.3.3. Enhanced nutrient uptake agents
10.5.15. Food & Beverages
10.5.15.1. Extraction of Natural Ingredients
10.5.15.1.1. Essential oils
10.5.15.1.2. Flavors
10.5.15.1.3. colors
10.5.15.2. Beverage Formulations
10.5.15.2.1. Solubilizers
10.5.15.2.2. Carriers for vitamins and supplements
10.5.15.2.3. Stabilizers in emulsions and syrups
10.5.15.3. Food Preservation
10.5.15.3.1. Antimicrobial agents
10.5.15.3.2. Moisture retention enhancers
10.5.15.3.3. Packaging adhesives
10.5.16. Electronics & Semiconductors
10.5.16.1. Printed Circuit Board (PCB) Cleaning
10.5.16.1.1. Removal of flux residues
10.5.16.1.2. Surface preparation solvents
10.5.16.1.3. High-purity cleaning agents
10.5.16.1.4. Others
10.5.16.2. Semiconductor Processing
10.5.16.2.1. Photoresist stripping solvents
10.5.16.2.2. Dielectric cleaning formulations
10.5.16.2.3. Solvent carriers for doping agents
10.5.16.2.4. Others
10.5.16.3. Battery Manufacturing
10.5.16.3.1. Electrolyte formulations
10.5.16.3.2. Solvent carriers for active materials
10.5.16.3.3. Stabilizers in lithium-based batteries
10.5.17. Market By Distribution Channel, Market Estimates and Forecast, USD Million,
Volume (Kiloton) 2019-2032
10.5.18. Offline
10.5.18.1. Distributors / Wholesalers
10.5.18.2. Retail Stores
10.5.18.3. Trade Fairs / Exhibitions / Conferences
10.5.19. Online
10.5.19.1. E-Commerce Platforms
10.5.19.2. Manufacturer Websites
10.5.19.3. Social Media & Influencer Marketing
10.5.19.4.Digital B2B Marketplaces
10.5.20. Market By Country, Market Estimates and Forecast, USD Million,
10.5.20.1. Brazil
10.5.20.2. Rest of LATAM
10.6. Middle East & Africa
10.6.1. Market By Type Estimates and Forecast, USD Million, Volume (Kiloton)
2019-2032
10.6.1.1. Bio-Alcohols
10.6.1.1.1. Ethanol
10.6.1.1.2. Butanol
10.6.1.1.3. Propanol
10.6.1.1.4. Isopropanol
10.6.1.2. Bio-Diols & Glycols
10.6.1.2.1. Propylene glycol
10.6.1.2.2. Butylene glycol
10.6.1.3. Lactate Esters
10.6.1.3.1. Ethyl lactate
10.6.1.3.2. Butyl lactate
10.6.1.4. Tarpenes
10.6.1.4.1. D-Limonene
10.6.1.4.2. Pinene
10.6.1.5. Fatty Acid Esters
10.6.1.5.1. Methyl soyate
10.6.1.5.2. Ethyl oleate
10.6.1.6. Water-Based Solvents
10.6.1.6.1. Non-ionic surfactants
10.6.1.6.2. Anionic surfactants
10.6.1.6.3. Cationic surfactants
10.6.1.7. Others
10.6.2. Market By Source, Market Estimates and Forecast, USD Million, Volume
(Kiloton) 2019-2032
10.6.3. Plant-Based
10.6.3.1. Soybean oil derivatives
10.6.3.2. Corn-based alcohols
10.6.3.3. Citrus peel extracts
10.6.3.4. Sugar-derived solvents
10.6.4.Agricultural Waste
10.6.4.1. Corn husks
10.6.4.2. Rice bran oil
10.6.4.3. Coconut shells
10.6.4.4. Sugarcane bagasse
10.6.4.5. Wheat straw
10.6.5.Algae-Derived Solvents
10.6.5.1. Microalgae lipid
10.6.5.2. Marine algae bio-oils
10.6.5.3. Omega-rich solvent
10.6.6.Algae-Derived Solvents
10.6.6.1. Microalgae lipid
10.6.6.2. Marine algae bio-oils
10.6.6.3. Omega-rich solvent
10.6.7.Bioengineered
10.6.7.1. Bio-butanol
10.6.7.2. Bio-propylene glycol
10.6.7.3. Bio-succinic acid
10.6.8.Other
10.6.9.Market By End Use, Market Estimates and Forecast, USD Million, Volume
(Kiloton) 2019-2032
10.6.10.
10.6.11. Personal Care & Cosmetics
10.6.11.1. Skincare
10.6.11.1.1. Creams
10.6.11.1.2. Lotions
10.6.11.1.3. Gels
10.6.11.1.4. Serums
10.6.11.1.5. Others
10.6.11.2. Hair Care
10.6.11.2.1. Shampoos
10.6.11.2.2. Conditioners
10.6.11.2.3. hair oils
10.6.11.2.4. Other
10.6.11.3. Makeup
10.6.11.3.1. Foundations
10.6.11.3.2. Primers
10.6.11.3.3. Concealers
10.6.11.3.4. antioxidants
10.6.11.3.5. Other
10.6.12. Pharmaceuticals & Healthcare
10.6.12.1. Drug Formulations
10.6.12.2. Vaccines & Biologics
10.6.12.3. Medical Devices & Diagnostics
10.6.13. Building & Construction
10.6.13.1. Architectural Coatings
10.6.13.1.1. Wall paints and primers
10.6.13.1.2. Waterproofing formulations
10.6.13.1.3. Anti-corrosion coatings
10.6.13.2. Industrial Coatings
10.6.13.2.1. Automotive paints
10.6.13.2.2. Protective coatings for machinery
10.6.13.2.3. Anti-fouling marine coatings
10.6.13.3. Printing Inks
10.6.13.3.1. Packaging inks
10.6.13.3.2. Textile printing formulations
10.6.13.3.3. Conductive inks for electronics
10.6.14. Agrochemicals
10.6.14.1. Pesticides & Herbicides
10.6.14.1.1. Solubilizers
10.6.14.1.2. Adjuvants
10.6.14.2. Fertilizers
10.6.14.2.1. nutrient blends
10.6.14.2.2. Adjuvants Chelating agents
10.6.14.3. Seed Treatment
10.6.14.3.1. seed coatings
10.6.14.3.2. Fungicidal and insecticidal carriers
10.6.14.3.3. Enhanced nutrient uptake agents
10.6.15. Food & Beverages
10.6.15.1. Extraction of Natural Ingredients
10.6.15.1.1. Essential oils
10.6.15.1.2. Flavors
10.6.15.1.3. colors
10.6.15.2. Beverage Formulations
10.6.15.2.1. Solubilizers
10.6.15.2.2. Carriers for vitamins and supplements
10.6.15.2.3. Stabilizers in emulsions and syrups
10.6.15.3. Food Preservation
10.6.15.3.1. Antimicrobial agents
10.6.15.3.2. Moisture retention enhancers
10.6.15.3.3. Packaging adhesives
10.6.16. Electronics & Semiconductors
10.6.16.1. Printed Circuit Board (PCB) Cleaning
10.6.16.1.1. Removal of flux residues
10.6.16.1.2. Surface preparation solvents
10.6.16.1.3. High-purity cleaning agents
10.6.16.1.4. Others
10.6.16.2. Semiconductor Processing
10.6.16.2.1. Photoresist stripping solvents
10.6.16.2.2. Dielectric cleaning formulations
10.6.16.2.3. Solvent carriers for doping agents
10.6.16.2.4. Others
10.6.16.3. Battery Manufacturing
10.6.16.3.1. Electrolyte formulations
10.6.16.3.2. Solvent carriers for active materials
10.6.16.3.3. Stabilizers in lithium-based batteries
10.6.17. Market By Distribution Channel, Market Estimates and Forecast, USD Million,
Volume (Kiloton) 2019-2032
10.6.18. Offline
10.6.18.1. Distributors / Wholesalers
10.6.18.2. Retail Stores
10.6.18.3. Trade Fairs / Exhibitions / Conferences
10.6.19. Online
10.6.19.1. E-Commerce Platforms
10.6.19.2. Manufacturer Websites
10.6.19.3. Social Media & Influencer Marketing
10.6.19.4. Digital B2B Marketplaces
10.6.20. Market By Country, Market Estimates and Forecast, USD Million,
10.6.20.1. Saudi Arabia
10.6.20.2. Rest of MEA
Chapter 11. Competitive Landscape
11.1. Market Revenue Share By Manufacturers
11.2. Mergers & Acquisitions
11.3. Competitor’s Positioning
11.4. Strategy Benchmarking
11.5. Vendor Landscape
11.5.1. Distributors
11.5.1.1. North America
11.5.1.2. Europe
11.5.1.3. Asia Pacific
11.5.1.4. Middle East & Africa
11.5.1.5. Latin America
Chapter 12. Company Profiles
12.1. BASF
12.1.1. Company Overview
12.1.2. Product & Service Offerings
12.1.3. Strategic Initiatives
12.1.4. Financials
12.2. Dow Chemical
12.2.1. Company Overview
12.2.2. Product & Service Offerings
12.2.3. Strategic Initiatives
12.2.4. Financials
12.3. DuPont
12.3.1. Company Overview
12.3.2. Product & Service Offerings
12.3.3. Strategic Initiatives
12.3.4. Financials
12.4. Solvay
12.4.1. Company Overview
12.4.2. Product & Service Offerings
12.4.3. Strategic Initiatives
12.4.4. Financials
12.5. Arkema
12.5.1. Company Overview
12.5.2. Product & Service Offerings
12.5.3. Strategic Initiatives
12.5.4. Financials
12.6. Novozymes
12.6.1. Company Overview
12.6.2. Product & Service Offerings
12.6.3. Strategic Initiatives
12.6.4. Financials
12.7. Clariant
12.7.1. Company Overview
12.7.2. Product & Service Offerings
12.7.3. Strategic Initiatives
12.7.4. Financials
12.7.5. Conclusion
12.8. Evonik
12.8.1. Company Overview
12.8.2. Product & Service Offerings
12.8.3. Strategic Initiatives
12.8.4. Financials
12.8.5. Conclusion
12.9. Mitsubishi Chemical Holdings Corporation
12.9.1. Company Overview
12.9.2. Product & Service Offerings
12.9.3. Strategic Initiatives
12.9.4. Financials
12.9.5. Conclusion
12.10. DSM (Koninklijke DSM N.V.)
12.10.1. Company Overview
12.10.2. Product & Service Offerings
12.10.3. Strategic Initiatives
12.10.4. Financials
12.10.5. Conclusion
12.11. Burt’s Bees
12.11.1. Company Overview
12.11.2. Product & Service Offerings
12.11.3. Strategic Initiatives
12.11.4. Financials
12.11.5. Conclusion
12.12. Cargill, Incorporated
12.12.1. Company Overview
12.12.2. Product & Service Offerings
12.12.3. Strategic Initiatives
12.12.4. Financials
12.12.5. Conclusion
12.13. ADM (Archer Daniels Midland Company)
12.13.1. Company Overview
12.13.2. Product & Service Offerings
12.13.3. Strategic Initiatives
12.13.4. Financials
12.13.5. Conclusion
12.14. InKemia Green Chemicals, Inc.
12.14.1. Company Overview
12.14.2. Product & Service Offerings
12.14.3. Strategic Initiatives
12.14.4. Financials
12.14.5. Conclusion
12.15. BioLogiQ, Inc.Dr.
12.15.1. Company Overview
12.15.2. Product & Service Offerings
12.15.3. Strategic Initiatives
12.15.4. Financials
12.15.5. Conclusion
12.16. GFBiochemicals Ltd.
12.16.1. Company Overview
12.16.2. Product & Service Offerings
12.16.3. Strategic Initiatives
12.16.4. Financials
12.16.5. Conclusion
12.17. Plantic Technologies Limited
12.17.1. Company Overview
12.17.2. Product & Service Offerings
12.17.3. Strategic Initiatives
12.17.4. Financials
12.17.5. Conclusion
12.18. VertecBioSolvents Inc.
12.18.1. Company Overview
12.18.2. Product & Service Offerings
12.18.3. Strategic Initiatives
12.18.4. Financials
12.18.5. Conclusion
12.19. Conagen, Inc.
12.19.1. Company Overview
12.19.2. Product & Service Offerings
12.19.3. Strategic Initiatives
12.19.4. Financials
12.19.5. Conclusion
12.20. Global Green Chemicals Public Company Limited
12.20.1. Company Overview
12.20.2. Product & Service Offerings
12.20.3. Strategic Initiatives
12.20.4. Financials
12.20.5. Conclusion
12.21. Impact Nano
12.21.1. Company Overview
12.21.2. Product & Service Offerings
12.21.3. Strategic Initiatives
12.21.4. Financials
12.21.5. Conclusion
12.22. Chemify
12.22.1. Company Overview
12.22.2. Product & Service Offerings
12.22.3. Strategic Initiatives
12.22.4. Financials
12.22.5. Conclusion
12.23. DUDE CHEMS
12.23.1. Company Overview
12.23.2. Product & Service Offerings
12.23.3. Strategic Initiatives
12.23.4. Financials
12.23.5. Conclusion
12.24. Gevo, Inc.
12.24.1. Company Overview
12.24.2. Product & Service Offerings
12.24.3. Strategic Initiatives
12.24.4. Financials
12.24.5. Conclusion
12.25. EnginZyme
12.25.1. Company Overview
12.25.2. Product & Service Offerings
12.25.3. Strategic Initiatives
12.25.4. Financials
12.25.5. Conclusion
Segments Covered in Report
For the purpose of this report, Advantia Business Consulting LLP. has segmented global Green Solvents market on the basis of By Type, By Source, By End Use, By Distribution Channel By End Use and By region for 2019 to 2032
- Global Green Solvents Market By Type Outlook (Revenue, USD Million 2019-2032)
- Bio-Alcohols
-
- Ethanol
-
- Butanol
-
- Propanol
-
- Isopropanol
- Bio-Diols & Glycols
-
- Propylene glycol
-
- Butylene glycol
- Lactate Esters
-
- Ethyl lactate
-
- Butyl lactate
- Tarpenes
-
- D-Limonene
-
- Pinene
- Fatty Acid Esters
-
- Methyl soyate
-
- Ethyl oleate
- Water-Based Solvents
-
- Non-ionic surfactants
-
- Anionic surfactants
-
- Cationic surfactants
- Others
- Global Green Solvents By Source (Revenue, USD Million; 2019-2032)
- Plant-Based
-
- Soybean oil derivatives
-
- Corn-based alcohols
-
- Citrus peel extracts
-
- Sugar-derived solvents
- Agricultural Waste
-
- Corn husks
-
- Rice bran oil
-
- Coconut shells
-
- Sugarcane bagasse
-
- Wheat straw
- Algae-Derived Solvents
-
- Microalgae lipid
-
- Marine algae bio-oils
-
- Omega-rich solvent
- Algae-Derived Solvents
-
- Microalgae lipid
-
- Marine algae bio-oils
-
- Omega-rich solvent
- Bioengineered
-
- Bio-butanol
-
- Bio-propylene glycol
-
- Bio-succinic acid
- Other
- Global Green Solvents By End Use Outlook (Revenue, USD Million; 2019-2032)
- Personal Care & Cosmetics
-
- Skincare
-
- Lotions
-
- Gels
-
- Serums
-
- Others
- Hair Care
-
- Shampoos
-
- Conditioners
-
- Hair oils
-
- Other
- Makeup
-
- Foundations
-
- Primers
-
- Concealers
-
- Antioxidants
-
- Other
- Pharmaceuticals & Healthcare
-
- Drug Formulations
-
- Vaccines & Biologics
-
- Medical Devices & Diagnostics
- Building & Construction
- Architectural Coatings
-
- Wall paints and primers
-
- Waterproofing formulations
-
- Anti-corrosion coatings
- Industrial Coatings
-
- Automotive Paints
-
- Protective coatings for machinery
-
- Anti-fouling marine coatings
- Printing Inks
-
- Packaging inks
-
- Textile printing formulations
-
- Conductive inks for electronics
- Agrochemicals
- Pesticides & Herbicides
-
- Solubilizers
-
- Adjuvants
- Fertilizers
-
- Nutrient blends
-
- Adjuvants Chelating agents
- Seed Treatment
-
- Seed coatings
-
- Fungicidal and insecticidal carriers
-
- Enhanced nutrient uptake agents
- Food & Beverages
- Extraction of Natural Ingredients
-
- Essential Oils
-
- Flavors
-
- Colors
- Beverage Formulations
-
- Solubilizers
-
- Carriers for vitamins and supplements
-
- Stabilizers in emulsions and syrups
- Food Preservation
-
- Antimicrobial agents
-
- Moisture retention enhancers
-
- Packaging adhesives
- Electronics & Semiconductors
- Extraction of Natural Ingredients
-
- Removal of flux residues
-
- Surface preparation solvents
-
- High-purity cleaning agents
-
- Others
- Semiconductor Processing
-
- Photoresist stripping solvents
-
- Dielectric cleaning formulations
-
- Solvent carriers for doping agents
-
- Others
- Battery Manufacturing
-
- Electrolyte formulations
-
- Solvent carriers for active materials
-
- Stabilizers in lithium-based batteries
- Global By Distribution Channel (Revenue, USD Million; 2019-2032)
- Offline
-
- Distributors / Wholesalers
-
- Retail Stores
-
- Trade Fairs / Exhibitions / Conferences
- Online
-
- E-Commerce Platforms
-
- Manufacturer Websites
-
- Social Media & Influencer Marketing
-
- Digital B2B Marketplaces
- North America
- North America Green Solvent Market By Type Outlook (Revenue, USD Million 2019-2032)
- Bio-Alcohols
-
- Ethanol
-
- Butanol
-
- Propanol
-
- Isopropanol
- Bio-Diols & Glycols
-
- Propylene glycol
-
- Butylene glycol
- Lactate Esters
-
- Ethyl lactate
-
- Butyl lactate
- Tarpenes
-
- D-Limonene
-
- Pinene
- Fatty Acid Esters
-
- Methyl soyate
-
- Ethyl oleate
- Water-Based Solvents
-
- Non-ionic surfactants
-
- Anionic surfactants
-
- Cationic surfactants
- Others
- North America Green Solvent Market By Source Outlook (Revenue, USD Million 2019-2032)
- Plant-Based
-
- Soybean oil derivatives
-
- Corn-based alcohols
-
- Citrus peel extracts
-
- Sugar-derived solvents
- Agricultural Waste
-
- Corn husks
-
- Rice bran oil
-
- Coconut shells
-
- Sugarcane bagasse
-
- Wheat straw
- Algae-Derived Solvents
-
- Microalgae lipid
-
- Marine algae bio-oils
-
- Omega-rich solvent
- Algae-Derived Solvents
-
- Microalgae lipid
-
- Marine algae bio-oils
-
- Omega-rich solvent
- Bioengineered
-
- Bio-butanol
-
- Bio-propylene glycol
-
- Bio-succinic acid
- Other
- North America Green Solvent Market By End Use Outlook (Revenue, USD Million 2019-2032)
- Personal Care & Cosmetics
-
- Skincare
-
- Lotions
-
- Gels
-
- Serums
-
- Others
- Hair Care
-
- Shampoos
-
- Conditioners
-
- Hair oils
-
- Other
- Makeup
-
- Foundations
-
- Primers
-
- Concealers
-
- Antioxidants
-
- Other
- Pharmaceuticals & Healthcare
-
- Drug Formulations
-
- Vaccines & Biologics
-
- Medical Devices & Diagnostics
- Building & Construction
- Architectural Coatings
-
- Wall paints and primers
-
- Waterproofing formulations
-
- Anti-corrosion coatings
- Industrial Coatings
-
- Automotive Paints
-
- Protective coatings for machinery
-
- Anti-fouling marine coatings
- Printing Inks
-
- Packaging inks
-
- Textile printing formulations
-
- Conductive inks for electronics
- Agrochemicals
- Pesticides & Herbicides
-
- Solubilizers
-
- Adjuvants
- Fertilizers
-
- Nutrient blends
-
- Adjuvants Chelating agents
- Seed Treatment
-
- Seed coatings
-
- Fungicidal and insecticidal carriers
-
- Enhanced nutrient uptake agents
- Food & Beverages
- Extraction of Natural Ingredients
-
- Essential Oils
-
- Flavors
-
- Colors
- Beverage Formulations
-
- Solubilizers
-
- Carriers for vitamins and supplements
-
- Stabilizers in emulsions and syrups
- Food Preservation
-
- Antimicrobial agents
-
- Moisture retention enhancers
-
- Packaging adhesives
- Electronics & Semiconductors
- Extraction of Natural Ingredients
-
- Removal of flux residues
-
- Surface preparation solvents
-
- High-purity cleaning agents
-
- Others
- Semiconductor Processing
-
- Photoresist stripping solvents
-
- Dielectric cleaning formulations
-
- Solvent carriers for doping agents
-
- Others
- Battery Manufacturing
-
- Electrolyte formulations
-
- Solvent carriers for active materials
-
- Stabilizers in lithium-based batteries
- North America Distribution Channel Outlook (Revenue, USD Million; 2019-2032)
- Offline
-
- Distributors / Wholesalers
-
- Retail Stores
-
- Trade Fairs / Exhibitions / Conferences
- Online
-
- E-Commerce Platforms
-
- Manufacturer Websites
-
- Social Media & Influencer Marketing
-
- Digital B2B Marketplaces
- U.S
- U.S Green Solvent Market By Ingredient Outlook (Revenue, USD Million 2019-2032)
- Bio-Alcohols
-
- Ethanol
-
- Butanol
-
- Propanol
-
- Isopropanol
- Bio-Diols & Glycols
-
- Propylene glycol
-
- Butylene glycol
- Lactate Esters
-
- Ethyl lactate
-
- Butyl lactate
- Tarpenes
-
- D-Limonene
-
- Pinene
- Fatty Acid Esters
-
- Methyl soyate
-
- Ethyl oleate
- Water-Based Solvents
-
- Non-ionic surfactants
-
- Anionic surfactants
-
- Cationic surfactants
- Others
- U.S Green Solvent Market By Source Outlook (Revenue, USD Million 2019-2032)
- Plant-Based
-
- Soybean oil derivatives
-
- Corn-based alcohols
-
- Citrus peel extracts
-
- Sugar-derived solvents
- Agricultural Waste
-
- Corn husks
-
- Rice bran oil
-
- Coconut shells
-
- Sugarcane bagasse
-
- Wheat straw
- Algae-Derived Solvents
-
- Microalgae lipid
-
- Marine algae bio-oils
-
- Omega-rich solvent
- Algae-Derived Solvents
-
- Microalgae lipid
-
- Marine algae bio-oils
-
- Omega-rich solvent
- Bioengineered
-
- Bio-butanol
-
- Bio-propylene glycol
-
- Bio-succinic acid
- Other
- U.S Green Solvent Market By End Use Outlook (Revenue, USD Million 2019-2032)
- Personal Care & Cosmetics
-
- Skincare
-
- Lotions
-
- Gels
-
- Serums
-
- Others
- Hair Care
-
- Shampoos
-
- Conditioners
-
- Hair oils
-
- Other
- Makeup
-
- Foundations
-
- Primers
-
- Concealers
-
- Antioxidants
-
- Other
- Pharmaceuticals & Healthcare
-
- Drug Formulations
-
- Vaccines & Biologics
-
- Medical Devices & Diagnostics
- Building & Construction
- Architectural Coatings
-
- Wall paints and primers
-
- Waterproofing formulations
-
- Anti-corrosion coatings
- Industrial Coatings
-
- Automotive Paints
-
- Protective coatings for machinery
-
- Anti-fouling marine coatings
- Printing Inks
-
- Packaging inks
-
- Textile printing formulations
-
- Conductive inks for electronics
- Agrochemicals
- Pesticides & Herbicides
-
- Solubilizers
-
- Adjuvants
- Fertilizers
-
- Nutrient blends
-
- Adjuvants Chelating agents
- Seed Treatment
-
- Seed coatings
-
- Fungicidal and insecticidal carriers
-
- Enhanced nutrient uptake agents
- Food & Beverages
- Extraction of Natural Ingredients
-
- Essential Oils
-
- Flavors
-
- Colors
- Beverage Formulations
-
- Solubilizers
-
- Carriers for vitamins and supplements
-
- Stabilizers in emulsions and syrups
- Food Preservation
-
- Antimicrobial agents
-
- Moisture retention enhancers
-
- Packaging adhesives
- Electronics & Semiconductors
- Extraction of Natural Ingredients
-
- Removal of flux residues
-
- Surface preparation solvents
-
- High-purity cleaning agents
-
- Others
- Semiconductor Processing
-
- Photoresist stripping solvents
-
- Dielectric cleaning formulations
-
- Solvent carriers for doping agents
-
- Others
- Battery Manufacturing
-
- Electrolyte formulations
-
- Solvent carriers for active materials
-
- Stabilizers in lithium-based batteries
- U.S Distribution Channel Outlook (Revenue, USD Million; 2019-2032)
- Offline
-
- Distributors / Wholesalers
-
- Retail Stores
-
- Trade Fairs / Exhibitions / Conferences
- Online
-
- E-Commerce Platforms
-
- Manufacturer Websites
-
- Social Media & Influencer Marketing
-
- Digital B2B Marketplaces
- Canada
- Canada Green Solvent Market By Ingredient Outlook (Revenue, USD Million 2019-2032)
- Bio-Alcohols
-
- Ethanol
-
- Butanol
-
- Propanol
-
- Isopropanol
- Bio-Diols & Glycols
-
- Propylene glycol
-
- Butylene glycol
- Lactate Esters
-
- Ethyl lactate
-
- Butyl lactate
- Tarpenes
-
- D-Limonene
-
- Pinene
- Fatty Acid Esters
-
- Methyl soyate
-
- Ethyl oleate
- Water-Based Solvents
-
- Non-ionic surfactants
-
- Anionic surfactants
-
- Cationic surfactants
- Others
- Canada Green Solvent Market By Source Outlook (Revenue, USD Million 2019-2032)
- Plant-Based
-
- Soybean oil derivatives
-
- Corn-based alcohols
-
- Citrus peel extracts
-
- Sugar-derived solvents
- Agricultural Waste
-
- Corn husks
-
- Rice bran oil
-
- Coconut shells
-
- Sugarcane bagasse
-
- Wheat straw
- Algae-Derived Solvents
-
- Microalgae lipid
-
- Marine algae bio-oils
-
- Omega-rich solvent
- Algae-Derived Solvents
-
- Microalgae lipid
-
- Marine algae bio-oils
-
- Omega-rich solvent
- Bioengineered
-
- Bio-butanol
-
- Bio-propylene glycol
-
- Bio-succinic acid
- Other
- Canada Green Solvent Market By End Use Outlook (Revenue, USD Million 2019-2032)
- Personal Care & Cosmetics
-
- Skincare
-
- Lotions
-
- Gels
-
- Serums
-
- Others
- Hair Care
-
- Shampoos
-
- Conditioners
-
- Hair oils
-
- Other
- Makeup
-
- Foundations
-
- Primers
-
- Concealers
-
- Antioxidants
-
- Other
- Pharmaceuticals & Healthcare
-
- Drug Formulations
-
- Vaccines & Biologics
-
- Medical Devices & Diagnostics
- Building & Construction
- Architectural Coatings
-
- Wall paints and primers
-
- Waterproofing formulations
-
- Anti-corrosion coatings
- Industrial Coatings
-
- Automotive Paints
-
- Protective coatings for machinery
-
- Anti-fouling marine coatings
- Printing Inks
-
- Packaging inks
-
- Textile printing formulations
-
- Conductive inks for electronics
- Agrochemicals
- Pesticides & Herbicides
-
- Solubilizers
-
- Adjuvants
- Fertilizers
-
- Nutrient blends
-
- Adjuvants Chelating agents
- Seed Treatment
-
- Seed coatings
-
- Fungicidal and insecticidal carriers
-
- Enhanced nutrient uptake agents
- Food & Beverages
- Extraction of Natural Ingredients
-
- Essential Oils
-
- Flavors
-
- Colors
- Beverage Formulations
-
- Solubilizers
-
- Carriers for vitamins and supplements
-
- Stabilizers in emulsions and syrups
- Food Preservation
-
- Antimicrobial agents
-
- Moisture retention enhancers
-
- Packaging adhesives
- Electronics & Semiconductors
- Extraction of Natural Ingredients
-
- Removal of flux residues
-
- Surface preparation solvents
-
- High-purity cleaning agents
-
- Others
- Semiconductor Processing
-
- Photoresist stripping solvents
-
- Dielectric cleaning formulations
-
- Solvent carriers for doping agents
-
- Others
- Battery Manufacturing
-
- Electrolyte formulations
-
- Solvent carriers for active materials
-
- Stabilizers in lithium-based batteries
- Canada Distribution Channel Outlook (Revenue, USD Million; 2019-2032)
- Offline
-
- Distributors / Wholesalers
-
- Retail Stores
-
- Trade Fairs / Exhibitions / Conferences
- Online
-
- E-Commerce Platforms
-
- Manufacturer Websites
-
- Social Media & Influencer Marketing
-
- Digital B2B Marketplaces
- Mexico
- Mexico Green Solvent Market By Ingredient Outlook (Revenue, USD Million 2019-2032)
- Bio-Alcohols
-
- Ethanol
-
- Butanol
-
- Propanol
-
- Isopropanol
- Bio-Diols & Glycols
-
- Propylene glycol
-
- Butylene glycol
- Lactate Esters
-
- Ethyl lactate
-
- Butyl lactate
- Tarpenes
-
- D-Limonene
-
- Pinene
- Fatty Acid Esters
-
- Methyl soyate
-
- Ethyl oleate
- Water-Based Solvents
-
- Non-ionic surfactants
-
- Anionic surfactants
-
- Cationic surfactants
- Others
- Mexico Green Solvent Market By Source Outlook (Revenue, USD Million 2019-2032)
- Plant-Based
-
- Soybean oil derivatives
-
- Corn-based alcohols
-
- Citrus peel extracts
-
- Sugar-derived solvents
- Agricultural Waste
-
- Corn husks
-
- Rice bran oil
-
- Coconut shells
-
- Sugarcane bagasse
-
- Wheat straw
- Algae-Derived Solvents
-
- Microalgae lipid
-
- Marine algae bio-oils
-
- Omega-rich solvent
- Algae-Derived Solvents
-
- Microalgae lipid
-
- Marine algae bio-oils
-
- Omega-rich solvent
- Bioengineered
-
- Bio-butanol
-
- Bio-propylene glycol
-
- Bio-succinic acid
- Other
- Mexico Green Solvent Market By End Use Outlook (Revenue, USD Million 2019-2032)
- Personal Care & Cosmetics
-
- Skincare
-
- Lotions
-
- Gels
-
- Serums
-
- Others
- Hair Care
-
- Shampoos
-
- Conditioners
-
- Hair oils
-
- Other
- Makeup
-
- Foundations
-
- Primers
-
- Concealers
-
- Antioxidants
-
- Other
- Pharmaceuticals & Healthcare
-
- Drug Formulations
-
- Vaccines & Biologics
-
- Medical Devices & Diagnostics
- Building & Construction
- Architectural Coatings
-
- Wall paints and primers
-
- Waterproofing formulations
-
- Anti-corrosion coatings
- Industrial Coatings
-
- Automotive Paints
-
- Protective coatings for machinery
-
- Anti-fouling marine coatings
- Printing Inks
-
- Packaging inks
-
- Textile printing formulations
-
- Conductive inks for electronics
- Agrochemicals
- Pesticides & Herbicides
-
- Solubilizers
-
- Adjuvants
- Fertilizers
-
- Nutrient blends
-
- Adjuvants Chelating agents
- Seed Treatment
-
- Seed coatings
-
- Fungicidal and insecticidal carriers
-
- Enhanced nutrient uptake agents
- Food & Beverages
- Extraction of Natural Ingredients
-
- Essential Oils
-
- Flavors
-
- Colors
- Beverage Formulations
-
- Solubilizers
-
- Carriers for vitamins and supplements
-
- Stabilizers in emulsions and syrups
- Food Preservation
-
- Antimicrobial agents
-
- Moisture retention enhancers
-
- Packaging adhesives
- Electronics & Semiconductors
- Extraction of Natural Ingredients
-
- Removal of flux residues
-
- Surface preparation solvents
-
- High-purity cleaning agents
-
- Others
- Semiconductor Processing
-
- Photoresist stripping solvents
-
- Dielectric cleaning formulations
-
- Solvent carriers for doping agents
-
- Others
- Battery Manufacturing
-
- Electrolyte formulations
-
- Solvent carriers for active materials
-
- Stabilizers in lithium-based batteries
- Mexico Distribution Channel Outlook (Revenue, USD Million; 2019-2032)
- Offline
-
- Distributors / Wholesalers
-
- Retail Stores
-
- Trade Fairs / Exhibitions / Conferences
- Online
-
- E-Commerce Platforms
-
- Manufacturer Websites
-
- Social Media & Influencer Marketing
-
- Digital B2B Marketplaces
- Europe
- Europe Green Solvent Market By Ingredient Outlook (Revenue, USD Million 2019-2032)
- Bio-Alcohols
-
- Ethanol
-
- Butanol
-
- Propanol
-
- Isopropanol
- Bio-Diols & Glycols
-
- Propylene glycol
-
- Butylene glycol
- Lactate Esters
-
- Ethyl lactate
-
- Butyl lactate
- Tarpenes
-
- D-Limonene
-
- Pinene
- Fatty Acid Esters
-
- Methyl soyate
-
- Ethyl oleate
- Water-Based Solvents
-
- Non-ionic surfactants
-
- Anionic surfactants
-
- Cationic surfactants
- Others
- Europe Green Solvent Market By Source Outlook (Revenue, USD Million 2019-2032)
- Plant-Based
-
- Soybean oil derivatives
-
- Corn-based alcohols
-
- Citrus peel extracts
-
- Sugar-derived solvents
- Agricultural Waste
-
- Corn husks
-
- Rice bran oil
-
- Coconut shells
-
- Sugarcane bagasse
-
- Wheat straw
- Algae-Derived Solvents
-
- Microalgae lipid
-
- Marine algae bio-oils
-
- Omega-rich solvent
- Algae-Derived Solvents
-
- Microalgae lipid
-
- Marine algae bio-oils
-
- Omega-rich solvent
- Bioengineered
-
- Bio-butanol
-
- Bio-propylene glycol
-
- Bio-succinic acid
- Other
- Europe Green Solvent Market By End Use Outlook (Revenue, USD Million 2019-2032)
- Personal Care & Cosmetics
-
- Skincare
-
- Lotions
-
- Gels
-
- Serums
-
- Others
- Hair Care
-
- Shampoos
-
- Conditioners
-
- Hair oils
-
- Other
- Makeup
-
- Foundations
-
- Primers
-
- Concealers
-
- Antioxidants
-
- Other
- Pharmaceuticals & Healthcare
-
- Drug Formulations
-
- Vaccines & Biologics
-
- Medical Devices & Diagnostics
- Building & Construction
- Architectural Coatings
-
- Wall paints and primers
-
- Waterproofing formulations
-
- Anti-corrosion coatings
- Industrial Coatings
-
- Automotive Paints
-
- Protective coatings for machinery
-
- Anti-fouling marine coatings
- Printing Inks
-
- Packaging inks
-
- Textile printing formulations
-
- Conductive inks for electronics
- Agrochemicals
- Pesticides & Herbicides
-
- Solubilizers
-
- Adjuvants
- Fertilizers
-
- Nutrient blends
-
- Adjuvants Chelating agents
- Seed Treatment
-
- Seed coatings
-
- Fungicidal and insecticidal carriers
-
- Enhanced nutrient uptake agents
- Food & Beverages
- Extraction of Natural Ingredients
-
- Essential Oils
-
- Flavors
-
- Colors
- Beverage Formulations
-
- Solubilizers
-
- Carriers for vitamins and supplements
-
- Stabilizers in emulsions and syrups
- Food Preservation
-
- Antimicrobial agents
-
- Moisture retention enhancers
-
- Packaging adhesives
- Electronics & Semiconductors
- Extraction of Natural Ingredients
-
- Removal of flux residues
-
- Surface preparation solvents
-
- High-purity cleaning agents
-
- Others
- Semiconductor Processing
-
- Photoresist stripping solvents
-
- Dielectric cleaning formulations
-
- Solvent carriers for doping agents
-
- Others
- Battery Manufacturing
-
- Electrolyte formulations
-
- Solvent carriers for active materials
-
- Stabilizers in lithium-based batteries
- Europe Distribution Channel Outlook (Revenue, USD Million; 2019-2032)
- Offline
-
- Distributors / Wholesalers
-
- Retail Stores
-
- Trade Fairs / Exhibitions / Conferences
- Online
-
- E-Commerce Platforms
-
- Manufacturer Websites
-
- Social Media & Influencer Marketing
-
- Digital B2B Marketplaces
- Germany
- Germany Green Solvent Market By Ingredient Outlook (Revenue, USD Million 2019-2032)
- Bio-Alcohols
-
- Ethanol
-
- Butanol
-
- Propanol
-
- Isopropanol
- Bio-Diols & Glycols
-
- Propylene glycol
-
- Butylene glycol
- Lactate Esters
-
- Ethyl lactate
-
- Butyl lactate
- Tarpenes
-
- D-Limonene
-
- Pinene
- Fatty Acid Esters
-
- Methyl soyate
-
- Ethyl oleate
- Water-Based Solvents
-
- Non-ionic surfactants
-
- Anionic surfactants
-
- Cationic surfactants
- Others
- Germany Green Solvent Market By Source Outlook (Revenue, USD Million 2019-2032)
- Plant-Based
-
- Soybean oil derivatives
-
- Corn-based alcohols
-
- Citrus peel extracts
-
- Sugar-derived solvents
- Agricultural Waste
-
- Corn husks
-
- Rice bran oil
-
- Coconut shells
-
- Sugarcane bagasse
-
- Wheat straw
- Algae-Derived Solvents
-
- Microalgae lipid
-
- Marine algae bio-oils
-
- Omega-rich solvent
- Algae-Derived Solvents
-
- Microalgae lipid
-
- Marine algae bio-oils
-
- Omega-rich solvent
- Bioengineered
-
- Bio-butanol
-
- Bio-propylene glycol
-
- Bio-succinic acid
- Other
- Germany Green Solvent Market By End Use Outlook (Revenue, USD Million 2019-2032)
- Personal Care & Cosmetics
-
- Skincare
-
- Lotions
-
- Gels
-
- Serums
-
- Others
- Hair Care
-
- Shampoos
-
- Conditioners
-
- Hair oils
-
- Other
- Makeup
-
- Foundations
-
- Primers
-
- Concealers
-
- Antioxidants
-
- Other
- Pharmaceuticals & Healthcare
-
- Drug Formulations
-
- Vaccines & Biologics
-
- Medical Devices & Diagnostics
- Building & Construction
- Architectural Coatings
-
- Wall paints and primers
-
- Waterproofing formulations
-
- Anti-corrosion coatings
- Industrial Coatings
-
- Automotive Paints
-
- Protective coatings for machinery
-
- Anti-fouling marine coatings
- Printing Inks
-
- Packaging inks
-
- Textile printing formulations
-
- Conductive inks for electronics
- Agrochemicals
- Pesticides & Herbicides
-
- Solubilizers
-
- Adjuvants
- Fertilizers
-
- Nutrient blends
-
- Adjuvants Chelating agents
- Seed Treatment
-
- Seed coatings
-
- Fungicidal and insecticidal carriers
-
- Enhanced nutrient uptake agents
- Food & Beverages
- Extraction of Natural Ingredients
-
- Essential Oils
-
- Flavors
-
- Colors
- Beverage Formulations
-
- Solubilizers
-
- Carriers for vitamins and supplements
-
- Stabilizers in emulsions and syrups
- Food Preservation
-
- Antimicrobial agents
-
- Moisture retention enhancers
-
- Packaging adhesives
- Electronics & Semiconductors
- Extraction of Natural Ingredients
-
- Removal of flux residues
-
- Surface preparation solvents
-
- High-purity cleaning agents
-
- Others
- Semiconductor Processing
-
- Photoresist stripping solvents
-
- Dielectric cleaning formulations
-
- Solvent carriers for doping agents
-
- Others
- Battery Manufacturing
-
- Electrolyte formulations
-
- Solvent carriers for active materials
-
- Stabilizers in lithium-based batteries
- Germany Distribution Channel Outlook (Revenue, USD Million; 2019-2032)
- Offline
-
- Distributors / Wholesalers
-
- Retail Stores
-
- Trade Fairs / Exhibitions / Conferences
- Online
-
- E-Commerce Platforms
-
- Manufacturer Websites
-
- Social Media & Influencer Marketing
-
- Digital B2B Marketplaces
- France
- France Green Solvent Market By Ingredient Outlook (Revenue, USD Million 2019-2032)
- Bio-Alcohols
-
- Ethanol
-
- Butanol
-
- Propanol
-
- Isopropanol
- Bio-Diols & Glycols
-
- Propylene glycol
-
- Butylene glycol
- Lactate Esters
-
- Ethyl lactate
-
- Butyl lactate
- Tarpenes
-
- D-Limonene
-
- Pinene
- Fatty Acid Esters
-
- Methyl soyate
-
- Ethyl oleate
- Water-Based Solvents
-
- Non-ionic surfactants
-
- Anionic surfactants
-
- Cationic surfactants
- Others
- France Green Solvent Market By Source Outlook (Revenue, USD Million 2019-2032)
- Plant-Based
-
- Soybean oil derivatives
-
- Corn-based alcohols
-
- Citrus peel extracts
-
- Sugar-derived solvents
- Agricultural Waste
-
- Corn husks
-
- Rice bran oil
-
- Coconut shells
-
- Sugarcane bagasse
-
- Wheat straw
- Algae-Derived Solvents
-
- Microalgae lipid
-
- Marine algae bio-oils
-
- Omega-rich solvent
- Algae-Derived Solvents
-
- Microalgae lipid
-
- Marine algae bio-oils
-
- Omega-rich solvent
- Bioengineered
-
- Bio-butanol
-
- Bio-propylene glycol
-
- Bio-succinic acid
- Other
- France Green Solvent Market By End Use Outlook (Revenue, USD Million 2019-2032)
- Personal Care & Cosmetics
-
- Skincare
-
- Lotions
-
- Gels
-
- Serums
-
- Others
- Hair Care
-
- Shampoos
-
- Conditioners
-
- Hair oils
-
- Other
- Makeup
-
- Foundations
-
- Primers
-
- Concealers
-
- Antioxidants
-
- Other
- Pharmaceuticals & Healthcare
-
- Drug Formulations
-
- Vaccines & Biologics
-
- Medical Devices & Diagnostics
- Building & Construction
- Architectural Coatings
-
- Wall paints and primers
-
- Waterproofing formulations
-
- Anti-corrosion coatings
- Industrial Coatings
-
- Automotive Paints
-
- Protective coatings for machinery
-
- Anti-fouling marine coatings
- Printing Inks
-
- Packaging inks
-
- Textile printing formulations
-
- Conductive inks for electronics
- Agrochemicals
- Pesticides & Herbicides
-
- Solubilizers
-
- Adjuvants
- Fertilizers
-
- Nutrient blends
-
- Adjuvants Chelating agents
- Seed Treatment
-
- Seed coatings
-
- Fungicidal and insecticidal carriers
-
- Enhanced nutrient uptake agents
- Food & Beverages
- Extraction of Natural Ingredients
-
- Essential Oils
-
- Flavors
-
- Colors
- Beverage Formulations
-
- Solubilizers
-
- Carriers for vitamins and supplements
-
- Stabilizers in emulsions and syrups
- Food Preservation
-
- Antimicrobial agents
-
- Moisture retention enhancers
-
- Packaging adhesives
- Electronics & Semiconductors
- Extraction of Natural Ingredients
-
- Removal of flux residues
-
- Surface preparation solvents
-
- High-purity cleaning agents
-
- Others
- Semiconductor Processing
-
- Photoresist stripping solvents
-
- Dielectric cleaning formulations
-
- Solvent carriers for doping agents
-
- Others
- Battery Manufacturing
-
- Electrolyte formulations
-
- Solvent carriers for active materials
-
- Stabilizers in lithium-based batteries
- France Distribution Channel Outlook (Revenue, USD Million; 2019-2032)
- Offline
-
- Distributors / Wholesalers
-
- Retail Stores
-
- Trade Fairs / Exhibitions / Conferences
- Online
-
- E-Commerce Platforms
-
- Manufacturer Websites
-
- Social Media & Influencer Marketing
-
- Digital B2B Marketplaces
- U.K
- U.K Green Solvent Market By Ingredient Outlook (Revenue, USD Million 2019-2032)
- Bio-Alcohols
-
- Ethanol
-
- Butanol
-
- Propanol
-
- Isopropanol
- Bio-Diols & Glycols
-
- Propylene glycol
-
- Butylene glycol
- Lactate Esters
-
- Ethyl lactate
-
- Butyl lactate
- Tarpenes
-
- D-Limonene
-
- Pinene
- Fatty Acid Esters
-
- Methyl soyate
-
- Ethyl oleate
- Water-Based Solvents
-
- Non-ionic surfactants
-
- Anionic surfactants
-
- Cationic surfactants
- Others
- U.K Green Solvent Market By Source Outlook (Revenue, USD Million 2019-2032)
- Plant-Based
-
- Soybean oil derivatives
-
- Corn-based alcohols
-
- Citrus peel extracts
-
- Sugar-derived solvents
- Agricultural Waste
-
- Corn husks
-
- Rice bran oil
-
- Coconut shells
-
- Sugarcane bagasse
-
- Wheat straw
- Algae-Derived Solvents
-
- Microalgae lipid
-
- Marine algae bio-oils
-
- Omega-rich solvent
- Algae-Derived Solvents
-
- Microalgae lipid
-
- Marine algae bio-oils
-
- Omega-rich solvent
- Bioengineered
-
- Bio-butanol
-
- Bio-propylene glycol
-
- Bio-succinic acid
- Other
- U.K Green Solvent Market By End Use Outlook (Revenue, USD Million 2019-2032)
- Personal Care & Cosmetics
-
- Skincare
-
- Lotions
-
- Gels
-
- Serums
-
- Others
- Hair Care
-
- Shampoos
-
- Conditioners
-
- Hair oils
-
- Other
- Makeup
-
- Foundations
-
- Primers
-
- Concealers
-
- Antioxidants
-
- Other
- Pharmaceuticals & Healthcare
-
- Drug Formulations
-
- Vaccines & Biologics
-
- Medical Devices & Diagnostics
- Building & Construction
- Architectural Coatings
-
- Wall paints and primers
-
- Waterproofing formulations
-
- Anti-corrosion coatings
- Industrial Coatings
-
- Automotive Paints
-
- Protective coatings for machinery
-
- Anti-fouling marine coatings
- Printing Inks
-
- Packaging inks
-
- Textile printing formulations
-
- Conductive inks for electronics
- Agrochemicals
- Pesticides & Herbicides
-
- Solubilizers
-
- Adjuvants
- Fertilizers
-
- Nutrient blends
-
- Adjuvants Chelating agents
- Seed Treatment
-
- Seed coatings
-
- Fungicidal and insecticidal carriers
-
- Enhanced nutrient uptake agents
- Food & Beverages
- Extraction of Natural Ingredients
-
- Essential Oils
-
- Flavors
-
- Colors
- Beverage Formulations
-
- Solubilizers
-
- Carriers for vitamins and supplements
-
- Stabilizers in emulsions and syrups
- Food Preservation
-
- Antimicrobial agents
-
- Moisture retention enhancers
-
- Packaging adhesives
- Electronics & Semiconductors
- Extraction of Natural Ingredients
-
- Removal of flux residues
-
- Surface preparation solvents
-
- High-purity cleaning agents
-
- Others
- Semiconductor Processing
-
- Photoresist stripping solvents
-
- Dielectric cleaning formulations
-
- Solvent carriers for doping agents
-
- Others
- Battery Manufacturing
-
- Electrolyte formulations
-
- Solvent carriers for active materials
-
- Stabilizers in lithium-based batteries
- U.K Distribution Channel Outlook (Revenue, USD Million; 2019-2032)
- Offline
-
- Distributors / Wholesalers
-
- Retail Stores
-
- Trade Fairs / Exhibitions / Conferences
- Online
-
- E-Commerce Platforms
-
- Manufacturer Websites
-
- Social Media & Influencer Marketing
-
- Digital B2B Marketplaces
- Italy
- Italy Green Solvent Market By Ingredient Outlook (Revenue, USD Million 2019-2032)
- Bio-Alcohols
-
- Ethanol
-
- Butanol
-
- Propanol
-
- Isopropanol
- Bio-Diols & Glycols
-
- Propylene glycol
-
- Butylene glycol
- Lactate Esters
-
- Ethyl lactate
-
- Butyl lactate
- Tarpenes
-
- D-Limonene
-
- Pinene
- Fatty Acid Esters
-
- Methyl soyate
-
- Ethyl oleate
- Water-Based Solvents
-
- Non-ionic surfactants
-
- Anionic surfactants
-
- Cationic surfactants
- Others
- Italy Green Solvent Market By Source Outlook (Revenue, USD Million 2019-2032)
- Plant-Based
-
- Soybean oil derivatives
-
- Corn-based alcohols
-
- Citrus peel extracts
-
- Sugar-derived solvents
- Agricultural Waste
-
- Corn husks
-
- Rice bran oil
-
- Coconut shells
-
- Sugarcane bagasse
-
- Wheat straw
- Algae-Derived Solvents
-
- Microalgae lipid
-
- Marine algae bio-oils
-
- Omega-rich solvent
- Algae-Derived Solvents
-
- Microalgae lipid
-
- Marine algae bio-oils
-
- Omega-rich solvent
- Bioengineered
-
- Bio-butanol
-
- Bio-propylene glycol
-
- Bio-succinic acid
- Other
- Italy Green Solvent Market By End Use Outlook (Revenue, USD Million 2019-2032)
- Personal Care & Cosmetics
-
- Skincare
-
- Lotions
-
- Gels
-
- Serums
-
- Others
- Hair Care
-
- Shampoos
-
- Conditioners
-
- Hair oils
-
- Other
- Makeup
-
- Foundations
-
- Primers
-
- Concealers
-
- Antioxidants
-
- Other
- Pharmaceuticals & Healthcare
-
- Drug Formulations
-
- Vaccines & Biologics
-
- Medical Devices & Diagnostics
- Building & Construction
- Architectural Coatings
-
- Wall paints and primers
-
- Waterproofing formulations
-
- Anti-corrosion coatings
- Industrial Coatings
-
- Automotive Paints
-
- Protective coatings for machinery
-
- Anti-fouling marine coatings
- Printing Inks
-
- Packaging inks
-
- Textile printing formulations
-
- Conductive inks for electronics
- Agrochemicals
- Pesticides & Herbicides
-
- Solubilizers
-
- Adjuvants
- Fertilizers
-
- Nutrient blends
-
- Adjuvants Chelating agents
- Seed Treatment
-
- Seed coatings
-
- Fungicidal and insecticidal carriers
-
- Enhanced nutrient uptake agents
- Food & Beverages
- Extraction of Natural Ingredients
-
- Essential Oils
-
- Flavors
-
- Colors
- Beverage Formulations
-
- Solubilizers
-
- Carriers for vitamins and supplements
-
- Stabilizers in emulsions and syrups
- Food Preservation
-
- Antimicrobial agents
-
- Moisture retention enhancers
-
- Packaging adhesives
- Electronics & Semiconductors
- Extraction of Natural Ingredients
-
- Removal of flux residues
-
- Surface preparation solvents
-
- High-purity cleaning agents
-
- Others
- Semiconductor Processing
-
- Photoresist stripping solvents
-
- Dielectric cleaning formulations
-
- Solvent carriers for doping agents
-
- Others
- Battery Manufacturing
-
- Electrolyte formulations
-
- Solvent carriers for active materials
-
- Stabilizers in lithium-based batteries
- Italy Distribution Channel Outlook (Revenue, USD Million; 2019-2032)
- Offline
-
- Distributors / Wholesalers
-
- Retail Stores
-
- Trade Fairs / Exhibitions / Conferences
- Online
-
- E-Commerce Platforms
-
- Manufacturer Websites
-
- Social Media & Influencer Marketing
-
- Digital B2B Marketplaces
- Spain
- Spain Green Solvent Market By Ingredient Outlook (Revenue, USD Million 2019-2032)
- Bio-Alcohols
-
- Ethanol
-
- Butanol
-
- Propanol
-
- Isopropanol
- Bio-Diols & Glycols
-
- Propylene glycol
-
- Butylene glycol
- Lactate Esters
-
- Ethyl lactate
-
- Butyl lactate
- Tarpenes
-
- D-Limonene
-
- Pinene
- Fatty Acid Esters
-
- Methyl soyate
-
- Ethyl oleate
- Water-Based Solvents
-
- Non-ionic surfactants
-
- Anionic surfactants
-
- Cationic surfactants
- Others
- Spain Green Solvent Market By Source Outlook (Revenue, USD Million 2019-2032)
- Plant-Based
-
- Soybean oil derivatives
-
- Corn-based alcohols
-
- Citrus peel extracts
-
- Sugar-derived solvents
- Agricultural Waste
-
- Corn husks
-
- Rice bran oil
-
- Coconut shells
-
- Sugarcane bagasse
-
- Wheat straw
- Algae-Derived Solvents
-
- Microalgae lipid
-
- Marine algae bio-oils
-
- Omega-rich solvent
- Algae-Derived Solvents
-
- Microalgae lipid
-
- Marine algae bio-oils
-
- Omega-rich solvent
- Bioengineered
-
- Bio-butanol
-
- Bio-propylene glycol
-
- Bio-succinic acid
- Other
- Spain Green Solvent Market By End Use Outlook (Revenue, USD Million 2019-2032)
- Personal Care & Cosmetics
-
- Skincare
-
- Lotions
-
- Gels
-
- Serums
-
- Others
- Hair Care
-
- Shampoos
-
- Conditioners
-
- Hair oils
-
- Other
- Makeup
-
- Foundations
-
- Primers
-
- Concealers
-
- Antioxidants
-
- Other
- Pharmaceuticals & Healthcare
-
- Drug Formulations
-
- Vaccines & Biologics
-
- Medical Devices & Diagnostics
- Building & Construction
- Architectural Coatings
-
- Wall paints and primers
-
- Waterproofing formulations
-
- Anti-corrosion coatings
- Industrial Coatings
-
- Automotive Paints
-
- Protective coatings for machinery
-
- Anti-fouling marine coatings
- Printing Inks
-
- Packaging inks
-
- Textile printing formulations
-
- Conductive inks for electronics
- Agrochemicals
- Pesticides & Herbicides
-
- Solubilizers
-
- Adjuvants
- Fertilizers
-
- Nutrient blends
-
- Adjuvants Chelating agents
- Seed Treatment
-
- Seed coatings
-
- Fungicidal and insecticidal carriers
-
- Enhanced nutrient uptake agents
- Food & Beverages
- Extraction of Natural Ingredients
-
- Essential Oils
-
- Flavors
-
- Colors
- Beverage Formulations
-
- Solubilizers
-
- Carriers for vitamins and supplements
-
- Stabilizers in emulsions and syrups
- Food Preservation
-
- Antimicrobial agents
-
- Moisture retention enhancers
-
- Packaging adhesives
- Electronics & Semiconductors
- Extraction of Natural Ingredients
-
- Removal of flux residues
-
- Surface preparation solvents
-
- High-purity cleaning agents
-
- Others
- Semiconductor Processing
-
- Photoresist stripping solvents
-
- Dielectric cleaning formulations
-
- Solvent carriers for doping agents
-
- Others
- Battery Manufacturing
-
- Electrolyte formulations
-
- Solvent carriers for active materials
-
- Stabilizers in lithium-based batteries
- Spain Distribution Channel Outlook (Revenue, USD Million; 2019-2032)
- Offline
-
- Distributors / Wholesalers
-
- Retail Stores
-
- Trade Fairs / Exhibitions / Conferences
- Online
-
- E-Commerce Platforms
-
- Manufacturer Websites
-
- Social Media & Influencer Marketing
-
- Digital B2B Marketplaces
- Benelux
- Benelux Green Solvent Market By Ingredient Outlook (Revenue, USD Million 2019-2032)
- Bio-Alcohols
-
- Ethanol
-
- Butanol
-
- Propanol
-
- Isopropanol
- Bio-Diols & Glycols
-
- Propylene glycol
-
- Butylene glycol
- Lactate Esters
-
- Ethyl lactate
-
- Butyl lactate
- Tarpenes
-
- D-Limonene
-
- Pinene
- Fatty Acid Esters
-
- Methyl soyate
-
- Ethyl oleate
- Water-Based Solvents
-
- Non-ionic surfactants
-
- Anionic surfactants
-
- Cationic surfactants
- Others
- Benelux Green Solvent Market By Source Outlook (Revenue, USD Million 2019-2032)
- Plant-Based
-
- Soybean oil derivatives
-
- Corn-based alcohols
-
- Citrus peel extracts
-
- Sugar-derived solvents
- Agricultural Waste
-
- Corn husks
-
- Rice bran oil
-
- Coconut shells
-
- Sugarcane bagasse
-
- Wheat straw
- Algae-Derived Solvents
-
- Microalgae lipid
-
- Marine algae bio-oils
-
- Omega-rich solvent
- Algae-Derived Solvents
-
- Microalgae lipid
-
- Marine algae bio-oils
-
- Omega-rich solvent
- Bioengineered
-
- Bio-butanol
-
- Bio-propylene glycol
-
- Bio-succinic acid
- Other
- Benelux Green Solvent Market By End Use Outlook (Revenue, USD Million 2019-2032)
- Personal Care & Cosmetics
-
- Skincare
-
- Lotions
-
- Gels
-
- Serums
-
- Others
- Hair Care
-
- Shampoos
-
- Conditioners
-
- Hair oils
-
- Other
- Makeup
-
- Foundations
-
- Primers
-
- Concealers
-
- Antioxidants
-
- Other
- Pharmaceuticals & Healthcare
-
- Drug Formulations
-
- Vaccines & Biologics
-
- Medical Devices & Diagnostics
- Building & Construction
- Architectural Coatings
-
- Wall paints and primers
-
- Waterproofing formulations
-
- Anti-corrosion coatings
- Industrial Coatings
-
- Automotive Paints
-
- Protective coatings for machinery
-
- Anti-fouling marine coatings
- Printing Inks
-
- Packaging inks
-
- Textile printing formulations
-
- Conductive inks for electronics
- Agrochemicals
- Pesticides & Herbicides
-
- Solubilizers
-
- Adjuvants
- Fertilizers
-
- Nutrient blends
-
- Adjuvants Chelating agents
- Seed Treatment
-
- Seed coatings
-
- Fungicidal and insecticidal carriers
-
- Enhanced nutrient uptake agents
- Food & Beverages
- Extraction of Natural Ingredients
-
- Essential Oils
-
- Flavors
-
- Colors
- Beverage Formulations
-
- Solubilizers
-
- Carriers for vitamins and supplements
-
- Stabilizers in emulsions and syrups
- Food Preservation
-
- Antimicrobial agents
-
- Moisture retention enhancers
-
- Packaging adhesives
- Electronics & Semiconductors
- Extraction of Natural Ingredients
-
- Removal of flux residues
-
- Surface preparation solvents
-
- High-purity cleaning agents
-
- Others
- Semiconductor Processing
-
- Photoresist stripping solvents
-
- Dielectric cleaning formulations
-
- Solvent carriers for doping agents
-
- Others
- Battery Manufacturing
-
- Electrolyte formulations
-
- Solvent carriers for active materials
-
- Stabilizers in lithium-based batteries
- Benelux Distribution Channel Outlook (Revenue, USD Million; 2019-2032)
- Offline
-
- Distributors / Wholesalers
-
- Retail Stores
-
- Trade Fairs / Exhibitions / Conferences
- Online
-
- E-Commerce Platforms
-
- Manufacturer Websites
-
- Social Media & Influencer Marketing
-
- Digital B2B Marketplaces
- Russia
- Russia Green Solvent Market By Ingredient Outlook (Revenue, USD Million 2019-2032)
- Bio-Alcohols
-
- Ethanol
-
- Butanol
-
- Propanol
-
- Isopropanol
- Bio-Diols & Glycols
-
- Propylene glycol
-
- Butylene glycol
- Lactate Esters
-
- Ethyl lactate
-
- Butyl lactate
- Tarpenes
-
- D-Limonene
-
- Pinene
- Fatty Acid Esters
-
- Methyl soyate
-
- Ethyl oleate
- Water-Based Solvents
-
- Non-ionic surfactants
-
- Anionic surfactants
-
- Cationic surfactants
- Others
- Russia Green Solvent Market By Source Outlook (Revenue, USD Million 2019-2032)
- Plant-Based
-
- Soybean oil derivatives
-
- Corn-based alcohols
-
- Citrus peel extracts
-
- Sugar-derived solvents
- Agricultural Waste
-
- Corn husks
-
- Rice bran oil
-
- Coconut shells
-
- Sugarcane bagasse
-
- Wheat straw
- Algae-Derived Solvents
-
- Microalgae lipid
-
- Marine algae bio-oils
-
- Omega-rich solvent
- Algae-Derived Solvents
-
- Microalgae lipid
-
- Marine algae bio-oils
-
- Omega-rich solvent
- Bioengineered
-
- Bio-butanol
-
- Bio-propylene glycol
-
- Bio-succinic acid
- Other
- Russia Green Solvent Market By End Use Outlook (Revenue, USD Million 2019-2032)
- Personal Care & Cosmetics
-
- Skincare
-
- Lotions
-
- Gels
-
- Serums
-
- Others
- Hair Care
-
- Shampoos
-
- Conditioners
-
- Hair oils
-
- Other
- Makeup
-
- Foundations
-
- Primers
-
- Concealers
-
- Antioxidants
-
- Other
- Pharmaceuticals & Healthcare
-
- Drug Formulations
-
- Vaccines & Biologics
-
- Medical Devices & Diagnostics
- Building & Construction
- Architectural Coatings
-
- Wall paints and primers
-
- Waterproofing formulations
-
- Anti-corrosion coatings
- Industrial Coatings
-
- Automotive Paints
-
- Protective coatings for machinery
-
- Anti-fouling marine coatings
- Printing Inks
-
- Packaging inks
-
- Textile printing formulations
-
- Conductive inks for electronics
- Agrochemicals
- Pesticides & Herbicides
-
- Solubilizers
-
- Adjuvants
- Fertilizers
-
- Nutrient blends
-
- Adjuvants Chelating agents
- Seed Treatment
-
- Seed coatings
-
- Fungicidal and insecticidal carriers
-
- Enhanced nutrient uptake agents
- Food & Beverages
- Extraction of Natural Ingredients
-
- Essential Oils
-
- Flavors
-
- Colors
- Beverage Formulations
-
- Solubilizers
-
- Carriers for vitamins and supplements
-
- Stabilizers in emulsions and syrups
- Food Preservation
-
- Antimicrobial agents
-
- Moisture retention enhancers
-
- Packaging adhesives
- Electronics & Semiconductors
- Extraction of Natural Ingredients
-
- Removal of flux residues
-
- Surface preparation solvents
-
- High-purity cleaning agents
-
- Others
- Semiconductor Processing
-
- Photoresist stripping solvents
-
- Dielectric cleaning formulations
-
- Solvent carriers for doping agents
-
- Others
- Battery Manufacturing
-
- Electrolyte formulations
-
- Solvent carriers for active materials
-
- Stabilizers in lithium-based batteries
- Russia Distribution Channel Outlook (Revenue, USD Million; 2019-2032)
- Offline
-
- Distributors / Wholesalers
-
- Retail Stores
-
- Trade Fairs / Exhibitions / Conferences
- Online
-
- E-Commerce Platforms
-
- Manufacturer Websites
-
- Social Media & Influencer Marketing
-
- Digital B2B Marketplaces
- Finland
- Finland Green Solvent Market By Ingredient Outlook (Revenue, USD Million 2019-2032)
- Bio-Alcohols
-
- Ethanol
-
- Butanol
-
- Propanol
-
- Isopropanol
- Bio-Diols & Glycols
-
- Propylene glycol
-
- Butylene glycol
- Lactate Esters
-
- Ethyl lactate
-
- Butyl lactate
- Tarpenes
-
- D-Limonene
-
- Pinene
- Fatty Acid Esters
-
- Methyl soyate
-
- Ethyl oleate
- Water-Based Solvents
-
- Non-ionic surfactants
-
- Anionic surfactants
-
- Cationic surfactants
- Others
- Finland Green Solvent Market By Source Outlook (Revenue, USD Million 2019-2032)
- Plant-Based
-
- Soybean oil derivatives
-
- Corn-based alcohols
-
- Citrus peel extracts
-
- Sugar-derived solvents
- Agricultural Waste
-
- Corn husks
-
- Rice bran oil
-
- Coconut shells
-
- Sugarcane bagasse
-
- Wheat straw
- Algae-Derived Solvents
-
- Microalgae lipid
-
- Marine algae bio-oils
-
- Omega-rich solvent
- Algae-Derived Solvents
-
- Microalgae lipid
-
- Marine algae bio-oils
-
- Omega-rich solvent
- Bioengineered
-
- Bio-butanol
-
- Bio-propylene glycol
-
- Bio-succinic acid
- Other
- Finland Green Solvent Market By End Use Outlook (Revenue, USD Million 2019-2032)
- Personal Care & Cosmetics
-
- Skincare
-
- Lotions
-
- Gels
-
- Serums
-
- Others
- Hair Care
-
- Shampoos
-
- Conditioners
-
- Hair oils
-
- Other
- Makeup
-
- Foundations
-
- Primers
-
- Concealers
-
- Antioxidants
-
- Other
- Pharmaceuticals & Healthcare
-
- Drug Formulations
-
- Vaccines & Biologics
-
- Medical Devices & Diagnostics
- Building & Construction
- Architectural Coatings
-
- Wall paints and primers
-
- Waterproofing formulations
-
- Anti-corrosion coatings
- Industrial Coatings
-
- Automotive Paints
-
- Protective coatings for machinery
-
- Anti-fouling marine coatings
- Printing Inks
-
- Packaging inks
-
- Textile printing formulations
-
- Conductive inks for electronics
- Agrochemicals
- Pesticides & Herbicides
-
- Solubilizers
-
- Adjuvants
- Fertilizers
-
- Nutrient blends
-
- Adjuvants Chelating agents
- Seed Treatment
-
- Seed coatings
-
- Fungicidal and insecticidal carriers
-
- Enhanced nutrient uptake agents
- Food & Beverages
- Extraction of Natural Ingredients
-
- Essential Oils
-
- Flavors
-
- Colors
- Beverage Formulations
-
- Solubilizers
-
- Carriers for vitamins and supplements
-
- Stabilizers in emulsions and syrups
- Food Preservation
-
- Antimicrobial agents
-
- Moisture retention enhancers
-
- Packaging adhesives
- Electronics & Semiconductors
- Extraction of Natural Ingredients
-
- Removal of flux residues
-
- Surface preparation solvents
-
- High-purity cleaning agents
-
- Others
- Semiconductor Processing
-
- Photoresist stripping solvents
-
- Dielectric cleaning formulations
-
- Solvent carriers for doping agents
-
- Others
- Battery Manufacturing
-
- Electrolyte formulations
-
- Solvent carriers for active materials
-
- Stabilizers in lithium-based batteries
- Finland Distribution Channel Outlook (Revenue, USD Million; 2019-2032)
- Offline
-
- Distributors / Wholesalers
-
- Retail Stores
-
- Trade Fairs / Exhibitions / Conferences
- Online
-
- E-Commerce Platforms
-
- Manufacturer Websites
-
- Social Media & Influencer Marketing
-
- Digital B2B Marketplaces
- Sweden
- Sweden Green Solvent Market By Ingredient Outlook (Revenue, USD Million 2019-2032)
- Bio-Alcohols
-
- Ethanol
-
- Butanol
-
- Propanol
-
- Isopropanol
- Bio-Diols & Glycols
-
- Propylene glycol
-
- Butylene glycol
- Lactate Esters
-
- Ethyl lactate
-
- Butyl lactate
- Tarpenes
-
- D-Limonene
-
- Pinene
- Fatty Acid Esters
-
- Methyl soyate
-
- Ethyl oleate
- Water-Based Solvents
-
- Non-ionic surfactants
-
- Anionic surfactants
-
- Cationic surfactants
- Others
- Sweden Green Solvent Market By Source Outlook (Revenue, USD Million 2019-2032)
- Plant-Based
-
- Soybean oil derivatives
-
- Corn-based alcohols
-
- Citrus peel extracts
-
- Sugar-derived solvents
- Agricultural Waste
-
- Corn husks
-
- Rice bran oil
-
- Coconut shells
-
- Sugarcane bagasse
-
- Wheat straw
- Algae-Derived Solvents
-
- Microalgae lipid
-
- Marine algae bio-oils
-
- Omega-rich solvent
- Algae-Derived Solvents
-
- Microalgae lipid
-
- Marine algae bio-oils
-
- Omega-rich solvent
- Bioengineered
-
- Bio-butanol
-
- Bio-propylene glycol
-
- Bio-succinic acid
- Other
- Sweden Green Solvent Market By End Use Outlook (Revenue, USD Million 2019-2032)
- Personal Care & Cosmetics
-
- Skincare
-
- Lotions
-
- Gels
-
- Serums
-
- Others
- Hair Care
-
- Shampoos
-
- Conditioners
-
- Hair oils
-
- Other
- Makeup
-
- Foundations
-
- Primers
-
- Concealers
-
- Antioxidants
-
- Other
- Pharmaceuticals & Healthcare
-
- Drug Formulations
-
- Vaccines & Biologics
-
- Medical Devices & Diagnostics
- Building & Construction
- Architectural Coatings
-
- Wall paints and primers
-
- Waterproofing formulations
-
- Anti-corrosion coatings
- Industrial Coatings
-
- Automotive Paints
-
- Protective coatings for machinery
-
- Anti-fouling marine coatings
- Printing Inks
-
- Packaging inks
-
- Textile printing formulations
-
- Conductive inks for electronics
- Agrochemicals
- Pesticides & Herbicides
-
- Solubilizers
-
- Adjuvants
- Fertilizers
-
- Nutrient blends
-
- Adjuvants Chelating agents
- Seed Treatment
-
- Seed coatings
-
- Fungicidal and insecticidal carriers
-
- Enhanced nutrient uptake agents
- Food & Beverages
- Extraction of Natural Ingredients
-
- Essential Oils
-
- Flavors
-
- Colors
- Beverage Formulations
-
- Solubilizers
-
- Carriers for vitamins and supplements
-
- Stabilizers in emulsions and syrups
- Food Preservation
-
- Antimicrobial agents
-
- Moisture retention enhancers
-
- Packaging adhesives
- Electronics & Semiconductors
- Extraction of Natural Ingredients
-
- Removal of flux residues
-
- Surface preparation solvents
-
- High-purity cleaning agents
-
- Others
- Semiconductor Processing
-
- Photoresist stripping solvents
-
- Dielectric cleaning formulations
-
- Solvent carriers for doping agents
-
- Others
- Battery Manufacturing
-
- Electrolyte formulations
-
- Solvent carriers for active materials
-
- Stabilizers in lithium-based batteries
- Sweden Distribution Channel Outlook (Revenue, USD Million; 2019-2032)
- Offline
-
- Distributors / Wholesalers
-
- Retail Stores
-
- Trade Fairs / Exhibitions / Conferences
- Online
-
- E-Commerce Platforms
-
- Manufacturer Websites
-
- Social Media & Influencer Marketing
-
- Digital B2B Marketplaces
- Rest of Europe
- Rest of Europe Green Solvent Market By Ingredient Outlook (Revenue, USD Million 2019-2032)
- Bio-Alcohols
-
- Ethanol
-
- Butanol
-
- Propanol
-
- Isopropanol
- Bio-Diols & Glycols
-
- Propylene glycol
-
- Butylene glycol
- Lactate Esters
-
- Ethyl lactate
-
- Butyl lactate
- Tarpenes
-
- D-Limonene
-
- Pinene
- Fatty Acid Esters
-
- Methyl soyate
-
- Ethyl oleate
- Water-Based Solvents
-
- Non-ionic surfactants
-
- Anionic surfactants
-
- Cationic surfactants
- Others
- Rest of Europe Green Solvent Market By Source Outlook (Revenue, USD Million 2019-2032)
- Plant-Based
-
- Soybean oil derivatives
-
- Corn-based alcohols
-
- Citrus peel extracts
-
- Sugar-derived solvents
- Agricultural Waste
-
- Corn husks
-
- Rice bran oil
-
- Coconut shells
-
- Sugarcane bagasse
-
- Wheat straw
- Algae-Derived Solvents
-
- Microalgae lipid
-
- Marine algae bio-oils
-
- Omega-rich solvent
- Algae-Derived Solvents
-
- Microalgae lipid
-
- Marine algae bio-oils
-
- Omega-rich solvent
- Bioengineered
-
- Bio-butanol
-
- Bio-propylene glycol
-
- Bio-succinic acid
- Other
- Rest of Europe Green Solvent Market By End Use Outlook (Revenue, USD Million 2019-2032)
- Personal Care & Cosmetics
-
- Skincare
-
- Lotions
-
- Gels
-
- Serums
-
- Others
- Hair Care
-
- Shampoos
-
- Conditioners
-
- Hair oils
-
- Other
- Makeup
-
- Foundations
-
- Primers
-
- Concealers
-
- Antioxidants
-
- Other
- Pharmaceuticals & Healthcare
-
- Drug Formulations
-
- Vaccines & Biologics
-
- Medical Devices & Diagnostics
- Building & Construction
- Architectural Coatings
-
- Wall paints and primers
-
- Waterproofing formulations
-
- Anti-corrosion coatings
- Industrial Coatings
-
- Automotive Paints
-
- Protective coatings for machinery
-
- Anti-fouling marine coatings
- Printing Inks
-
- Packaging inks
-
- Textile printing formulations
-
- Conductive inks for electronics
- Agrochemicals
- Pesticides & Herbicides
-
- Solubilizers
-
- Adjuvants
- Fertilizers
-
- Nutrient blends
-
- Adjuvants Chelating agents
- Seed Treatment
-
- Seed coatings
-
- Fungicidal and insecticidal carriers
-
- Enhanced nutrient uptake agents
- Food & Beverages
- Extraction of Natural Ingredients
-
- Essential Oils
-
- Flavors
-
- Colors
- Beverage Formulations
-
- Solubilizers
-
- Carriers for vitamins and supplements
-
- Stabilizers in emulsions and syrups
- Food Preservation
-
- Antimicrobial agents
-
- Moisture retention enhancers
-
- Packaging adhesives
- Electronics & Semiconductors
- Extraction of Natural Ingredients
-
- Removal of flux residues
-
- Surface preparation solvents
-
- High-purity cleaning agents
-
- Others
- Semiconductor Processing
-
- Photoresist stripping solvents
-
- Dielectric cleaning formulations
-
- Solvent carriers for doping agents
-
- Others
- Battery Manufacturing
-
- Electrolyte formulations
-
- Solvent carriers for active materials
-
- Stabilizers in lithium-based batteries
- Rest of Europe Distribution Channel Outlook (Revenue, USD Million; 2019-2032)
- Offline
-
- Distributors / Wholesalers
-
- Retail Stores
-
- Trade Fairs / Exhibitions / Conferences
- Online
-
- E-Commerce Platforms
-
- Manufacturer Websites
-
- Social Media & Influencer Marketing
-
- Digital B2B Marketplaces
- Asia-Pacific
- Asia-Pacific Green Solvent Market By Ingredient Outlook (Revenue, USD Million 2019-2032)
- Bio-Alcohols
-
- Ethanol
-
- Butanol
-
- Propanol
-
- Isopropanol
- Bio-Diols & Glycols
-
- Propylene glycol
-
- Butylene glycol
- Lactate Esters
-
- Ethyl lactate
-
- Butyl lactate
- Tarpenes
-
- D-Limonene
-
- Pinene
- Fatty Acid Esters
-
- Methyl soyate
-
- Ethyl oleate
- Water-Based Solvents
-
- Non-ionic surfactants
-
- Anionic surfactants
-
- Cationic surfactants
- Others
- Asia-Pacific Green Solvent Market By Source Outlook (Revenue, USD Million 2019-2032)
- Plant-Based
-
- Soybean oil derivatives
-
- Corn-based alcohols
-
- Citrus peel extracts
-
- Sugar-derived solvents
- Agricultural Waste
-
- Corn husks
-
- Rice bran oil
-
- Coconut shells
-
- Sugarcane bagasse
-
- Wheat straw
- Algae-Derived Solvents
-
- Microalgae lipid
-
- Marine algae bio-oils
-
- Omega-rich solvent
- Algae-Derived Solvents
-
- Microalgae lipid
-
- Marine algae bio-oils
-
- Omega-rich solvent
- Bioengineered
-
- Bio-butanol
-
- Bio-propylene glycol
-
- Bio-succinic acid
- Other
- Asia-Pacific Green Solvent Market By End Use Outlook (Revenue, USD Million 2019-2032)
- Personal Care & Cosmetics
-
- Skincare
-
- Lotions
-
- Gels
-
- Serums
-
- Others
- Hair Care
-
- Shampoos
-
- Conditioners
-
- Hair oils
-
- Other
- Makeup
-
- Foundations
-
- Primers
-
- Concealers
-
- Antioxidants
-
- Other
- Pharmaceuticals & Healthcare
-
- Drug Formulations
-
- Vaccines & Biologics
-
- Medical Devices & Diagnostics
- Building & Construction
- Architectural Coatings
-
- Wall paints and primers
-
- Waterproofing formulations
-
- Anti-corrosion coatings
- Industrial Coatings
-
- Automotive Paints
-
- Protective coatings for machinery
-
- Anti-fouling marine coatings
- Printing Inks
-
- Packaging inks
-
- Textile printing formulations
-
- Conductive inks for electronics
- Agrochemicals
- Pesticides & Herbicides
-
- Solubilizers
-
- Adjuvants
- Fertilizers
-
- Nutrient blends
-
- Adjuvants Chelating agents
- Seed Treatment
-
- Seed coatings
-
- Fungicidal and insecticidal carriers
-
- Enhanced nutrient uptake agents
- Food & Beverages
- Extraction of Natural Ingredients
-
- Essential Oils
-
- Flavors
-
- Colors
- Beverage Formulations
-
- Solubilizers
-
- Carriers for vitamins and supplements
-
- Stabilizers in emulsions and syrups
- Food Preservation
-
- Antimicrobial agents
-
- Moisture retention enhancers
-
- Packaging adhesives
- Electronics & Semiconductors
- Extraction of Natural Ingredients
-
- Removal of flux residues
-
- Surface preparation solvents
-
- High-purity cleaning agents
-
- Others
- Semiconductor Processing
-
- Photoresist stripping solvents
-
- Dielectric cleaning formulations
-
- Solvent carriers for doping agents
-
- Others
- Battery Manufacturing
-
- Electrolyte formulations
-
- Solvent carriers for active materials
-
- Stabilizers in lithium-based batteries
- Asia-Pacific Distribution Channel Outlook (Revenue, USD Million; 2019-2032)
- Offline
-
- Distributors / Wholesalers
-
- Retail Stores
-
- Trade Fairs / Exhibitions / Conferences
- Online
-
- E-Commerce Platforms
-
- Manufacturer Websites
-
- Social Media & Influencer Marketing
-
- Digital B2B Marketplaces
- China
- China Green Solvent Market By Ingredient Outlook (Revenue, USD Million 2019-2032)
- Bio-Alcohols
-
- Ethanol
-
- Butanol
-
- Propanol
-
- Isopropanol
- Bio-Diols & Glycols
-
- Propylene glycol
-
- Butylene glycol
- Lactate Esters
-
- Ethyl lactate
-
- Butyl lactate
- Tarpenes
-
- D-Limonene
-
- Pinene
- Fatty Acid Esters
-
- Methyl soyate
-
- Ethyl oleate
- Water-Based Solvents
-
- Non-ionic surfactants
-
- Anionic surfactants
-
- Cationic surfactants
- Others
- China Green Solvent Market By Source Outlook (Revenue, USD Million 2019-2032)
- Plant-Based
-
- Soybean oil derivatives
-
- Corn-based alcohols
-
- Citrus peel extracts
-
- Sugar-derived solvents
- Agricultural Waste
-
- Corn husks
-
- Rice bran oil
-
- Coconut shells
-
- Sugarcane bagasse
-
- Wheat straw
- Algae-Derived Solvents
-
- Microalgae lipid
-
- Marine algae bio-oils
-
- Omega-rich solvent
- Algae-Derived Solvents
-
- Microalgae lipid
-
- Marine algae bio-oils
-
- Omega-rich solvent
- Bioengineered
-
- Bio-butanol
-
- Bio-propylene glycol
-
- Bio-succinic acid
- Other
- China Green Solvent Market By End Use Outlook (Revenue, USD Million 2019-2032)
- Personal Care & Cosmetics
-
- Skincare
-
- Lotions
-
- Gels
-
- Serums
-
- Others
- Hair Care
-
- Shampoos
-
- Conditioners
-
- Hair oils
-
- Other
- Makeup
-
- Foundations
-
- Primers
-
- Concealers
-
- Antioxidants
-
- Other
- Pharmaceuticals & Healthcare
-
- Drug Formulations
-
- Vaccines & Biologics
-
- Medical Devices & Diagnostics
- Building & Construction
- Architectural Coatings
-
- Wall paints and primers
-
- Waterproofing formulations
-
- Anti-corrosion coatings
- Industrial Coatings
-
- Automotive Paints
-
- Protective coatings for machinery
-
- Anti-fouling marine coatings
- Printing Inks
-
- Packaging inks
-
- Textile printing formulations
-
- Conductive inks for electronics
- Agrochemicals
- Pesticides & Herbicides
-
- Solubilizers
-
- Adjuvants
- Fertilizers
-
- Nutrient blends
-
- Adjuvants Chelating agents
- Seed Treatment
-
- Seed coatings
-
- Fungicidal and insecticidal carriers
-
- Enhanced nutrient uptake agents
- Food & Beverages
- Extraction of Natural Ingredients
-
- Essential Oils
-
- Flavors
-
- Colors
- Beverage Formulations
-
- Solubilizers
-
- Carriers for vitamins and supplements
-
- Stabilizers in emulsions and syrups
- Food Preservation
-
- Antimicrobial agents
-
- Moisture retention enhancers
-
- Packaging adhesives
- Electronics & Semiconductors
- Extraction of Natural Ingredients
-
- Removal of flux residues
-
- Surface preparation solvents
-
- High-purity cleaning agents
-
- Others
- Semiconductor Processing
-
- Photoresist stripping solvents
-
- Dielectric cleaning formulations
-
- Solvent carriers for doping agents
-
- Others
- Battery Manufacturing
-
- Electrolyte formulations
-
- Solvent carriers for active materials
-
- Stabilizers in lithium-based batteries
- China Distribution Channel Outlook (Revenue, USD Million; 2019-2032)
- Offline
-
- Distributors / Wholesalers
-
- Retail Stores
-
- Trade Fairs / Exhibitions / Conferences
- Online
-
- E-Commerce Platforms
-
- Manufacturer Websites
-
- Social Media & Influencer Marketing
-
- Digital B2B Marketplaces
- India
- India Green Solvent Market By Ingredient Outlook (Revenue, USD Million 2019-2032)
- Bio-Alcohols
-
- Ethanol
-
- Butanol
-
- Propanol
-
- Isopropanol
- Bio-Diols & Glycols
-
- Propylene glycol
-
- Butylene glycol
- Lactate Esters
-
- Ethyl lactate
-
- Butyl lactate
- Tarpenes
-
- D-Limonene
-
- Pinene
- Fatty Acid Esters
-
- Methyl soyate
-
- Ethyl oleate
- Water-Based Solvents
-
- Non-ionic surfactants
-
- Anionic surfactants
-
- Cationic surfactants
- Others
- India Green Solvent Market By Source Outlook (Revenue, USD Million 2019-2032)
- Plant-Based
-
- Soybean oil derivatives
-
- Corn-based alcohols
-
- Citrus peel extracts
-
- Sugar-derived solvents
- Agricultural Waste
-
- Corn husks
-
- Rice bran oil
-
- Coconut shells
-
- Sugarcane bagasse
-
- Wheat straw
- Algae-Derived Solvents
-
- Microalgae lipid
-
- Marine algae bio-oils
-
- Omega-rich solvent
- Algae-Derived Solvents
-
- Microalgae lipid
-
- Marine algae bio-oils
-
- Omega-rich solvent
- Bioengineered
-
- Bio-butanol
-
- Bio-propylene glycol
-
- Bio-succinic acid
- Other
- India Green Solvent Market By End Use Outlook (Revenue, USD Million 2019-2032)
- Personal Care & Cosmetics
-
- Skincare
-
- Lotions
-
- Gels
-
- Serums
-
- Others
- Hair Care
-
- Shampoos
-
- Conditioners
-
- Hair oils
-
- Other
- Makeup
-
- Foundations
-
- Primers
-
- Concealers
-
- Antioxidants
-
- Other
- Pharmaceuticals & Healthcare
-
- Drug Formulations
-
- Vaccines & Biologics
-
- Medical Devices & Diagnostics
- Building & Construction
- Architectural Coatings
-
- Wall paints and primers
-
- Waterproofing formulations
-
- Anti-corrosion coatings
- Industrial Coatings
-
- Automotive Paints
-
- Protective coatings for machinery
-
- Anti-fouling marine coatings
- Printing Inks
-
- Packaging inks
-
- Textile printing formulations
-
- Conductive inks for electronics
- Agrochemicals
- Pesticides & Herbicides
-
- Solubilizers
-
- Adjuvants
- Fertilizers
-
- Nutrient blends
-
- Adjuvants Chelating agents
- Seed Treatment
-
- Seed coatings
-
- Fungicidal and insecticidal carriers
-
- Enhanced nutrient uptake agents
- Food & Beverages
- Extraction of Natural Ingredients
-
- Essential Oils
-
- Flavors
-
- Colors
- Beverage Formulations
-
- Solubilizers
-
- Carriers for vitamins and supplements
-
- Stabilizers in emulsions and syrups
- Food Preservation
-
- Antimicrobial agents
-
- Moisture retention enhancers
-
- Packaging adhesives
- Electronics & Semiconductors
- Extraction of Natural Ingredients
-
- Removal of flux residues
-
- Surface preparation solvents
-
- High-purity cleaning agents
-
- Others
- Semiconductor Processing
-
- Photoresist stripping solvents
-
- Dielectric cleaning formulations
-
- Solvent carriers for doping agents
-
- Others
- Battery Manufacturing
-
- Electrolyte formulations
-
- Solvent carriers for active materials
-
- Stabilizers in lithium-based batteries
- India Distribution Channel Outlook (Revenue, USD Million; 2019-2032)
- Offline
-
- Distributors / Wholesalers
-
- Retail Stores
-
- Trade Fairs / Exhibitions / Conferences
- Online
-
- E-Commerce Platforms
-
- Manufacturer Websites
-
- Social Media & Influencer Marketing
-
- Digital B2B Marketplaces
- Japan
- Japan Green Solvent Market By Ingredient Outlook (Revenue, USD Million 2019-2032)
- Bio-Alcohols
-
- Ethanol
-
- Butanol
-
- Propanol
-
- Isopropanol
- Bio-Diols & Glycols
-
- Propylene glycol
-
- Butylene glycol
- Lactate Esters
-
- Ethyl lactate
-
- Butyl lactate
- Tarpenes
-
- D-Limonene
-
- Pinene
- Fatty Acid Esters
-
- Methyl soyate
-
- Ethyl oleate
- Water-Based Solvents
-
- Non-ionic surfactants
-
- Anionic surfactants
-
- Cationic surfactants
- Others
- Japan Green Solvent Market By Source Outlook (Revenue, USD Million 2019-2032)
- Plant-Based
-
- Soybean oil derivatives
-
- Corn-based alcohols
-
- Citrus peel extracts
-
- Sugar-derived solvents
- Agricultural Waste
-
- Corn husks
-
- Rice bran oil
-
- Coconut shells
-
- Sugarcane bagasse
-
- Wheat straw
- Algae-Derived Solvents
-
- Microalgae lipid
-
- Marine algae bio-oils
-
- Omega-rich solvent
- Algae-Derived Solvents
-
- Microalgae lipid
-
- Marine algae bio-oils
-
- Omega-rich solvent
- Bioengineered
-
- Bio-butanol
-
- Bio-propylene glycol
-
- Bio-succinic acid
- Other
- Japan Green Solvent Market By End Use Outlook (Revenue, USD Million 2019-2032)
- Personal Care & Cosmetics
-
- Skincare
-
- Lotions
-
- Gels
-
- Serums
-
- Others
- Hair Care
-
- Shampoos
-
- Conditioners
-
- Hair oils
-
- Other
- Makeup
-
- Foundations
-
- Primers
-
- Concealers
-
- Antioxidants
-
- Other
- Pharmaceuticals & Healthcare
-
- Drug Formulations
-
- Vaccines & Biologics
-
- Medical Devices & Diagnostics
- Building & Construction
- Architectural Coatings
-
- Wall paints and primers
-
- Waterproofing formulations
-
- Anti-corrosion coatings
- Industrial Coatings
-
- Automotive Paints
-
- Protective coatings for machinery
-
- Anti-fouling marine coatings
- Printing Inks
-
- Packaging inks
-
- Textile printing formulations
-
- Conductive inks for electronics
- Agrochemicals
- Pesticides & Herbicides
-
- Solubilizers
-
- Adjuvants
- Fertilizers
-
- Nutrient blends
-
- Adjuvants Chelating agents
- Seed Treatment
-
- Seed coatings
-
- Fungicidal and insecticidal carriers
-
- Enhanced nutrient uptake agents
- Food & Beverages
- Extraction of Natural Ingredients
-
- Essential Oils
-
- Flavors
-
- Colors
- Beverage Formulations
-
- Solubilizers
-
- Carriers for vitamins and supplements
-
- Stabilizers in emulsions and syrups
- Food Preservation
-
- Antimicrobial agents
-
- Moisture retention enhancers
-
- Packaging adhesives
- Electronics & Semiconductors
- Extraction of Natural Ingredients
-
- Removal of flux residues
-
- Surface preparation solvents
-
- High-purity cleaning agents
-
- Others
- Semiconductor Processing
-
- Photoresist stripping solvents
-
- Dielectric cleaning formulations
-
- Solvent carriers for doping agents
-
- Others
- Battery Manufacturing
-
- Electrolyte formulations
-
- Solvent carriers for active materials
-
- Stabilizers in lithium-based batteries
- Japan Distribution Channel Outlook (Revenue, USD Million; 2019-2032)
- Offline
-
- Distributors / Wholesalers
-
- Retail Stores
-
- Trade Fairs / Exhibitions / Conferences
- Online
-
- E-Commerce Platforms
-
- Manufacturer Websites
-
- Social Media & Influencer Marketing
-
- Digital B2B Marketplaces
- South Korea
- South Korea Green Solvent Market By Ingredient Outlook (Revenue, USD Million 2019-2032)
- Bio-Alcohols
-
- Ethanol
-
- Butanol
-
- Propanol
-
- Isopropanol
- Bio-Diols & Glycols
-
- Propylene glycol
-
- Butylene glycol
- Lactate Esters
-
- Ethyl lactate
-
- Butyl lactate
- Tarpenes
-
- D-Limonene
-
- Pinene
- Fatty Acid Esters
-
- Methyl soyate
-
- Ethyl oleate
- Water-Based Solvents
-
- Non-ionic surfactants
-
- Anionic surfactants
-
- Cationic surfactants
- Others
- South Korea Green Solvent Market By Source Outlook (Revenue, USD Million 2019-2032)
- Plant-Based
-
- Soybean oil derivatives
-
- Corn-based alcohols
-
- Citrus peel extracts
-
- Sugar-derived solvents
- Agricultural Waste
-
- Corn husks
-
- Rice bran oil
-
- Coconut shells
-
- Sugarcane bagasse
-
- Wheat straw
- Algae-Derived Solvents
-
- Microalgae lipid
-
- Marine algae bio-oils
-
- Omega-rich solvent
- Algae-Derived Solvents
-
- Microalgae lipid
-
- Marine algae bio-oils
-
- Omega-rich solvent
- Bioengineered
-
- Bio-butanol
-
- Bio-propylene glycol
-
- Bio-succinic acid
- Other
- South Korea Green Solvent Market By End Use Outlook (Revenue, USD Million 2019-2032)
- Personal Care & Cosmetics
-
- Skincare
-
- Lotions
-
- Gels
-
- Serums
-
- Others
- Hair Care
-
- Shampoos
-
- Conditioners
-
- Hair oils
-
- Other
- Makeup
-
- Foundations
-
- Primers
-
- Concealers
-
- Antioxidants
-
- Other
- Pharmaceuticals & Healthcare
-
- Drug Formulations
-
- Vaccines & Biologics
-
- Medical Devices & Diagnostics
- Building & Construction
- Architectural Coatings
-
- Wall paints and primers
-
- Waterproofing formulations
-
- Anti-corrosion coatings
- Industrial Coatings
-
- Automotive Paints
-
- Protective coatings for machinery
-
- Anti-fouling marine coatings
- Printing Inks
-
- Packaging inks
-
- Textile printing formulations
-
- Conductive inks for electronics
- Agrochemicals
- Pesticides & Herbicides
-
- Solubilizers
-
- Adjuvants
- Fertilizers
-
- Nutrient blends
-
- Adjuvants Chelating agents
- Seed Treatment
-
- Seed coatings
-
- Fungicidal and insecticidal carriers
-
- Enhanced nutrient uptake agents
- Food & Beverages
- Extraction of Natural Ingredients
-
- Essential Oils
-
- Flavors
-
- Colors
- Beverage Formulations
-
- Solubilizers
-
- Carriers for vitamins and supplements
-
- Stabilizers in emulsions and syrups
- Food Preservation
-
- Antimicrobial agents
-
- Moisture retention enhancers
-
- Packaging adhesives
- Electronics & Semiconductors
- Extraction of Natural Ingredients
-
- Removal of flux residues
-
- Surface preparation solvents
-
- High-purity cleaning agents
-
- Others
- Semiconductor Processing
-
- Photoresist stripping solvents
-
- Dielectric cleaning formulations
-
- Solvent carriers for doping agents
-
- Others
- Battery Manufacturing
-
- Electrolyte formulations
-
- Solvent carriers for active materials
-
- Stabilizers in lithium-based batteries
- South Korea Distribution Channel Outlook (Revenue, USD Million; 2019-2032)
- Offline
-
- Distributors / Wholesalers
-
- Retail Stores
-
- Trade Fairs / Exhibitions / Conferences
- Online
-
- E-Commerce Platforms
-
- Manufacturer Websites
-
- Social Media & Influencer Marketing
-
- Digital B2B Marketplaces
- Indonesia
- Indonesia Green Solvent Market By Ingredient Outlook (Revenue, USD Million 2019-2032)
- Bio-Alcohols
-
- Ethanol
-
- Butanol
-
- Propanol
-
- Isopropanol
- Bio-Diols & Glycols
-
- Propylene glycol
-
- Butylene glycol
- Lactate Esters
-
- Ethyl lactate
-
- Butyl lactate
- Tarpenes
-
- D-Limonene
-
- Pinene
- Fatty Acid Esters
-
- Methyl soyate
-
- Ethyl oleate
- Water-Based Solvents
-
- Non-ionic surfactants
-
- Anionic surfactants
-
- Cationic surfactants
- Others
- Indonesia Green Solvent Market By Source Outlook (Revenue, USD Million 2019-2032)
- Plant-Based
-
- Soybean oil derivatives
-
- Corn-based alcohols
-
- Citrus peel extracts
-
- Sugar-derived solvents
- Agricultural Waste
-
- Corn husks
-
- Rice bran oil
-
- Coconut shells
-
- Sugarcane bagasse
-
- Wheat straw
- Algae-Derived Solvents
-
- Microalgae lipid
-
- Marine algae bio-oils
-
- Omega-rich solvent
- Algae-Derived Solvents
-
- Microalgae lipid
-
- Marine algae bio-oils
-
- Omega-rich solvent
- Bioengineered
-
- Bio-butanol
-
- Bio-propylene glycol
-
- Bio-succinic acid
- Other
- Indonesia Green Solvent Market By End Use Outlook (Revenue, USD Million 2019-2032)
- Personal Care & Cosmetics
-
- Skincare
-
- Lotions
-
- Gels
-
- Serums
-
- Others
- Hair Care
-
- Shampoos
-
- Conditioners
-
- Hair oils
-
- Other
- Makeup
-
- Foundations
-
- Primers
-
- Concealers
-
- Antioxidants
-
- Other
- Pharmaceuticals & Healthcare
-
- Drug Formulations
-
- Vaccines & Biologics
-
- Medical Devices & Diagnostics
- Building & Construction
- Architectural Coatings
-
- Wall paints and primers
-
- Waterproofing formulations
-
- Anti-corrosion coatings
- Industrial Coatings
-
- Automotive Paints
-
- Protective coatings for machinery
-
- Anti-fouling marine coatings
- Printing Inks
-
- Packaging inks
-
- Textile printing formulations
-
- Conductive inks for electronics
- Agrochemicals
- Pesticides & Herbicides
-
- Solubilizers
-
- Adjuvants
- Fertilizers
-
- Nutrient blends
-
- Adjuvants Chelating agents
- Seed Treatment
-
- Seed coatings
-
- Fungicidal and insecticidal carriers
-
- Enhanced nutrient uptake agents
- Food & Beverages
- Extraction of Natural Ingredients
-
- Essential Oils
-
- Flavors
-
- Colors
- Beverage Formulations
-
- Solubilizers
-
- Carriers for vitamins and supplements
-
- Stabilizers in emulsions and syrups
- Food Preservation
-
- Antimicrobial agents
-
- Moisture retention enhancers
-
- Packaging adhesives
- Electronics & Semiconductors
- Extraction of Natural Ingredients
-
- Removal of flux residues
-
- Surface preparation solvents
-
- High-purity cleaning agents
-
- Others
- Semiconductor Processing
-
- Photoresist stripping solvents
-
- Dielectric cleaning formulations
-
- Solvent carriers for doping agents
-
- Others
- Battery Manufacturing
-
- Electrolyte formulations
-
- Solvent carriers for active materials
-
- Stabilizers in lithium-based batteries
- Indonesia Distribution Channel Outlook (Revenue, USD Million; 2019-2032)
- Offline
-
- Distributors / Wholesalers
-
- Retail Stores
-
- Trade Fairs / Exhibitions / Conferences
- Online
-
- E-Commerce Platforms
-
- Manufacturer Websites
-
- Social Media & Influencer Marketing
-
- Digital B2B Marketplaces
- Thailand
- Thailand Green Solvent Market By Ingredient Outlook (Revenue, USD Million 2019-2032)
- Bio-Alcohols
-
- Ethanol
-
- Butanol
-
- Propanol
-
- Isopropanol
- Bio-Diols & Glycols
-
- Propylene glycol
-
- Butylene glycol
- Lactate Esters
-
- Ethyl lactate
-
- Butyl lactate
- Tarpenes
-
- D-Limonene
-
- Pinene
- Fatty Acid Esters
-
- Methyl soyate
-
- Ethyl oleate
- Water-Based Solvents
-
- Non-ionic surfactants
-
- Anionic surfactants
-
- Cationic surfactants
- Others
-
- Thailand Green Solvent Market By Source Outlook (Revenue, USD Million 2019-2032)
- Plant-Based
-
- Soybean oil derivatives
-
- Corn-based alcohols
-
- Citrus peel extracts
-
- Sugar-derived solvents
- Agricultural Waste
-
- Corn husks
-
- Rice bran oil
-
- Coconut shells
-
- Sugarcane bagasse
-
- Wheat straw
- Algae-Derived Solvents
-
- Microalgae lipid
-
- Marine algae bio-oils
-
- Omega-rich solvent
- Algae-Derived Solvents
-
- Microalgae lipid
-
- Marine algae bio-oils
-
- Omega-rich solvent
- Bioengineered
-
- Bio-butanol
-
- Bio-propylene glycol
-
- Bio-succinic acid
- Other
- Thailand Green Solvent Market By End Use Outlook (Revenue, USD Million 2019-2032)
- Personal Care & Cosmetics
-
- Skincare
-
- Lotions
-
- Gels
-
- Serums
-
- Others
- Hair Care
-
- Shampoos
-
- Conditioners
-
- Hair oils
-
- Other
- Makeup
-
- Foundations
-
- Primers
-
- Concealers
-
- Antioxidants
-
- Other
- Pharmaceuticals & Healthcare
-
- Drug Formulations
-
- Vaccines & Biologics
-
- Medical Devices & Diagnostics
- Building & Construction
- Architectural Coatings
-
- Wall paints and primers
-
- Waterproofing formulations
-
- Anti-corrosion coatings
- Industrial Coatings
-
- Automotive Paints
-
- Protective coatings for machinery
-
- Anti-fouling marine coatings
- Printing Inks
-
- Packaging inks
-
- Textile printing formulations
-
- Conductive inks for electronics
- Agrochemicals
- Pesticides & Herbicides
-
- Solubilizers
-
- Adjuvants
- Fertilizers
-
- Nutrient blends
-
- Adjuvants Chelating agents
- Seed Treatment
-
- Seed coatings
-
- Fungicidal and insecticidal carriers
-
- Enhanced nutrient uptake agents
- Food & Beverages
- Extraction of Natural Ingredients
-
- Essential Oils
-
- Flavors
-
- Colors
- Beverage Formulations
-
- Solubilizers
-
- Carriers for vitamins and supplements
-
- Stabilizers in emulsions and syrups
- Food Preservation
-
- Antimicrobial agents
-
- Moisture retention enhancers
-
- Packaging adhesives
- Electronics & Semiconductors
- Extraction of Natural Ingredients
-
- Removal of flux residues
-
- Surface preparation solvents
-
- High-purity cleaning agents
-
- Others
- Semiconductor Processing
-
- Photoresist stripping solvents
-
- Dielectric cleaning formulations
-
- Solvent carriers for doping agents
-
- Others
- Battery Manufacturing
-
- Electrolyte formulations
-
- Solvent carriers for active materials
-
- Stabilizers in lithium-based batteries
- Thailand Distribution Channel Outlook (Revenue, USD Million; 2019-2032)
- Offline
-
- Distributors / Wholesalers
-
- Retail Stores
-
- Trade Fairs / Exhibitions / Conferences
- Online
-
- E-Commerce Platforms
-
- Manufacturer Websites
-
- Social Media & Influencer Marketing
-
- Digital B2B Marketplaces
- Vietnam
- Vietnam Green Solvent Market By Ingredient Outlook (Revenue, USD Million 2019-2032)
- Bio-Alcohols
-
- Ethanol
-
- Butanol
-
- Propanol
-
- Isopropanol
- Bio-Diols & Glycols
-
- Propylene glycol
-
- Butylene glycol
- Lactate Esters
-
- Ethyl lactate
-
- Butyl lactate
- Tarpenes
-
- D-Limonene
-
- Pinene
- Fatty Acid Esters
-
- Methyl soyate
-
- Ethyl oleate
- Water-Based Solvents
-
- Non-ionic surfactants
-
- Anionic surfactants
-
- Cationic surfactants
- Others
- Vietnam Green Solvent Market By Source Outlook (Revenue, USD Million 2019-2032)
- Plant-Based
-
- Soybean oil derivatives
-
- Corn-based alcohols
-
- Citrus peel extracts
-
- Sugar-derived solvents
- Agricultural Waste
-
- Corn husks
-
- Rice bran oil
-
- Coconut shells
-
- Sugarcane bagasse
-
- Wheat straw
- Algae-Derived Solvents
-
- Microalgae lipid
-
- Marine algae bio-oils
-
- Omega-rich solvent
- Algae-Derived Solvents
-
- Microalgae lipid
-
- Marine algae bio-oils
-
- Omega-rich solvent
- Bioengineered
-
- Bio-butanol
-
- Bio-propylene glycol
-
- Bio-succinic acid
- Other
- Vietnam Green Solvent Market By End Use Outlook (Revenue, USD Million 2019-2032)
- Personal Care & Cosmetics
-
- Skincare
-
- Lotions
-
- Gels
-
- Serums
-
- Others
- Hair Care
-
- Shampoos
-
- Conditioners
-
- Hair oils
-
- Other
- Makeup
-
- Foundations
-
- Primers
-
- Concealers
-
- Antioxidants
-
- Other
- Pharmaceuticals & Healthcare
-
- Drug Formulations
-
- Vaccines & Biologics
-
- Medical Devices & Diagnostics
- Building & Construction
- Architectural Coatings
-
- Wall paints and primers
-
- Waterproofing formulations
-
- Anti-corrosion coatings
- Industrial Coatings
-
- Automotive Paints
-
- Protective coatings for machinery
-
- Anti-fouling marine coatings
- Printing Inks
-
- Packaging inks
-
- Textile printing formulations
-
- Conductive inks for electronics
- Agrochemicals
- Pesticides & Herbicides
-
- Solubilizers
-
- Adjuvants
- Fertilizers
-
- Nutrient blends
-
- Adjuvants Chelating agents
- Seed Treatment
-
- Seed coatings
-
- Fungicidal and insecticidal carriers
-
- Enhanced nutrient uptake agents
- Food & Beverages
- Extraction of Natural Ingredients
-
- Essential Oils
-
- Flavors
-
- Colors
- Beverage Formulations
-
- Solubilizers
-
- Carriers for vitamins and supplements
-
- Stabilizers in emulsions and syrups
- Food Preservation
-
- Antimicrobial agents
-
- Moisture retention enhancers
-
- Packaging adhesives
- Electronics & Semiconductors
- Extraction of Natural Ingredients
-
- Removal of flux residues
-
- Surface preparation solvents
-
- High-purity cleaning agents
-
- Others
- Semiconductor Processing
-
- Photoresist stripping solvents
-
- Dielectric cleaning formulations
-
- Solvent carriers for doping agents
-
- Others
- Battery Manufacturing
-
- Electrolyte formulations
-
- Solvent carriers for active materials
-
- Stabilizers in lithium-based batteries
- Vietnam Distribution Channel Outlook (Revenue, USD Million; 2019-2032)
- Offline
-
- Distributors / Wholesalers
-
- Retail Stores
-
- Trade Fairs / Exhibitions / Conferences
- Online
-
- E-Commerce Platforms
-
- Manufacturer Websites
-
- Social Media & Influencer Marketing
-
- Digital B2B Marketplaces
- Australia
- Australia Green Solvent Market By Ingredient Outlook (Revenue, USD Million 2019-2032)
- Bio-Alcohols
-
- Ethanol
-
- Butanol
-
- Propanol
-
- Isopropanol
- Bio-Diols & Glycols
-
- Propylene glycol
-
- Butylene glycol
- Lactate Esters
-
- Ethyl lactate
-
- Butyl lactate
- Tarpenes
-
- D-Limonene
-
- Pinene
- Fatty Acid Esters
-
- Methyl soyate
-
- Ethyl oleate
- Water-Based Solvents
-
- Non-ionic surfactants
-
- Anionic surfactants
-
- Cationic surfactants
- Others
- Australia Green Solvent Market By Source Outlook (Revenue, USD Million 2019-2032)
- Plant-Based
-
- Soybean oil derivatives
-
- Corn-based alcohols
-
- Citrus peel extracts
-
- Sugar-derived solvents
- Agricultural Waste
-
- Corn husks
-
- Rice bran oil
-
- Coconut shells
-
- Sugarcane bagasse
-
- Wheat straw
- Algae-Derived Solvents
-
- Microalgae lipid
-
- Marine algae bio-oils
-
- Omega-rich solvent
- Algae-Derived Solvents
-
- Microalgae lipid
-
- Marine algae bio-oils
-
- Omega-rich solvent
- Bioengineered
-
- Bio-butanol
-
- Bio-propylene glycol
-
- Bio-succinic acid
- Other
- Australia Green Solvent Market By End Use Outlook (Revenue, USD Million 2019-2032)
- Personal Care & Cosmetics
-
- Skincare
-
- Lotions
-
- Gels
-
- Serums
-
- Others
- Hair Care
-
- Shampoos
-
- Conditioners
-
- Hair oils
-
- Other
- Makeup
-
- Foundations
-
- Primers
-
- Concealers
-
- Antioxidants
-
- Other
- Pharmaceuticals & Healthcare
-
- Drug Formulations
-
- Vaccines & Biologics
-
- Medical Devices & Diagnostics
- Building & Construction
- Architectural Coatings
-
- Wall paints and primers
-
- Waterproofing formulations
-
- Anti-corrosion coatings
- Industrial Coatings
-
- Automotive Paints
-
- Protective coatings for machinery
-
- Anti-fouling marine coatings
- Printing Inks
-
- Packaging inks
-
- Textile printing formulations
-
- Conductive inks for electronics
- Agrochemicals
- Pesticides & Herbicides
-
- Solubilizers
-
- Adjuvants
- Fertilizers
-
- Nutrient blends
-
- Adjuvants Chelating agents
- Seed Treatment
-
- Seed coatings
-
- Fungicidal and insecticidal carriers
-
- Enhanced nutrient uptake agents
- Food & Beverages
- Extraction of Natural Ingredients
-
- Essential Oils
-
- Flavors
-
- Colors
- Beverage Formulations
-
- Solubilizers
-
- Carriers for vitamins and supplements
-
- Stabilizers in emulsions and syrups
- Food Preservation
-
- Antimicrobial agents
-
- Moisture retention enhancers
-
- Packaging adhesives
- Electronics & Semiconductors
- Extraction of Natural Ingredients
-
- Removal of flux residues
-
- Surface preparation solvents
-
- High-purity cleaning agents
-
- Others
- Semiconductor Processing
-
- Photoresist stripping solvents
-
- Dielectric cleaning formulations
-
- Solvent carriers for doping agents
-
- Others
- Battery Manufacturing
-
- Electrolyte formulations
-
- Solvent carriers for active materials
-
- Stabilizers in lithium-based batteries
- Australia Distribution Channel Outlook (Revenue, USD Million; 2019-2032)
- Offline
-
- Distributors / Wholesalers
-
- Retail Stores
-
- Trade Fairs / Exhibitions / Conferences
- Online
-
- E-Commerce Platforms
-
- Manufacturer Websites
-
- Social Media & Influencer Marketing
-
- Digital B2B Marketplaces
- New Zealand
- New Zealand Green Solvent Market By Ingredient Outlook (Revenue, USD Million 2019-2032)
- Bio-Alcohols
-
- Ethanol
-
- Butanol
-
- Propanol
-
- Isopropanol
- Bio-Diols & Glycols
-
- Propylene glycol
-
- Butylene glycol
- Lactate Esters
-
- Ethyl lactate
-
- Butyl lactate
- Tarpenes
-
- D-Limonene
-
- Pinene
- Fatty Acid Esters
-
- Methyl soyate
-
- Ethyl oleate
- Water-Based Solvents
-
- Non-ionic surfactants
-
- Anionic surfactants
-
- Cationic surfactants
- Others
- New Zealand Green Solvent Market By Source Outlook (Revenue, USD Million 2019-2032)
- Plant-Based
-
- Soybean oil derivatives
-
- Corn-based alcohols
-
- Citrus peel extracts
-
- Sugar-derived solvents
- Agricultural Waste
-
- Corn husks
-
- Rice bran oil
-
- Coconut shells
-
- Sugarcane bagasse
-
- Wheat straw
- Algae-Derived Solvents
-
- Microalgae lipid
-
- Marine algae bio-oils
-
- Omega-rich solvent
- Algae-Derived Solvents
-
- Microalgae lipid
-
- Marine algae bio-oils
-
- Omega-rich solvent
- Bioengineered
-
- Bio-butanol
-
- Bio-propylene glycol
-
- Bio-succinic acid
- Other
- New Zealand Green Solvent Market By End Use Outlook (Revenue, USD Million 2019-2032)
- Personal Care & Cosmetics
-
- Skincare
-
- Lotions
-
- Gels
-
- Serums
-
- Others
- Hair Care
-
- Shampoos
-
- Conditioners
-
- Hair oils
-
- Other
- Makeup
-
- Foundations
-
- Primers
-
- Concealers
-
- Antioxidants
-
- Other
- Pharmaceuticals & Healthcare
-
- Drug Formulations
-
- Vaccines & Biologics
-
- Medical Devices & Diagnostics
- Building & Construction
- Architectural Coatings
-
- Wall paints and primers
-
- Waterproofing formulations
-
- Anti-corrosion coatings
- Industrial Coatings
-
- Automotive Paints
-
- Protective coatings for machinery
-
- Anti-fouling marine coatings
- Printing Inks
-
- Packaging inks
-
- Textile printing formulations
-
- Conductive inks for electronics
- Agrochemicals
- Pesticides & Herbicides
-
- Solubilizers
-
- Adjuvants
- Fertilizers
-
- Nutrient blends
-
- Adjuvants Chelating agents
- Seed Treatment
-
- Seed coatings
-
- Fungicidal and insecticidal carriers
-
- Enhanced nutrient uptake agents
- Food & Beverages
- Extraction of Natural Ingredients
-
- Essential Oils
-
- Flavors
-
- Colors
- Beverage Formulations
-
- Solubilizers
-
- Carriers for vitamins and supplements
-
- Stabilizers in emulsions and syrups
- Food Preservation
-
- Antimicrobial agents
-
- Moisture retention enhancers
-
- Packaging adhesives
- Electronics & Semiconductors
- Extraction of Natural Ingredients
-
- Removal of flux residues
-
- Surface preparation solvents
-
- High-purity cleaning agents
-
- Others
- Semiconductor Processing
-
- Photoresist stripping solvents
-
- Dielectric cleaning formulations
-
- Solvent carriers for doping agents
-
- Others
- Battery Manufacturing
-
- Electrolyte formulations
-
- Solvent carriers for active materials
-
- Stabilizers in lithium-based batteries
- New Zealand Distribution Channel Outlook (Revenue, USD Million; 2019-2032)
- Offline
-
- Distributors / Wholesalers
-
- Retail Stores
-
- Trade Fairs / Exhibitions / Conferences
- Online
-
- E-Commerce Platforms
-
- Manufacturer Websites
-
- Social Media & Influencer Marketing
-
- Digital B2B Marketplaces
- Latin-America
- Latin-America Green Solvent Market By Ingredient Outlook (Revenue, USD Million 2019-2032)
- Bio-Alcohols
- Ethanol
- Butanol
- Propanol
- Isopropanol
- Bio-Diols & Glycols
- Propylene glycol
- Butylene glycol
- Lactate Esters
- Ethyl lactate
- Butyl lactate
- Tarpenes
- D-Limonene
- Pinene
- Fatty Acid Esters
- Methyl soyate
- Ethyl oleate
- Water-Based Solvents
- Non-ionic surfactants
- Anionic surfactants
- Cationic surfactants
- Others
- Latin-America Green Solvent Market By Source Outlook (Revenue, USD Million 2019-2032)
- Plant-Based
- Soybean oil derivatives
- Corn-based alcohols
- Citrus peel extracts
- Sugar-derived solvents
- Agricultural Waste
- Corn husks
- Rice bran oil
- Coconut shells
- Sugarcane bagasse
- Wheat straw
- Algae-Derived Solvents
- Microalgae lipid
- Marine algae bio-oils
- Omega-rich solvent
- Algae-Derived Solvents
- Microalgae lipid
- Marine algae bio-oils
- Omega-rich solvent
- Bioengineered
- Bio-butanol
- Bio-propylene glycol
- Bio-succinic acid
- Other
- Latin-America Green Solvent Market By End Use Outlook (Revenue, USD Million 2019-2032)
- Personal Care & Cosmetics
- Skincare
- Lotions
- Gels
- Serums
- Others
- Hair Care
- Shampoos
- Conditioners
- hair oils
- Other
- Makeup
- Foundations
- Primers
- Concealers
- antioxidants
- Other
- Pharmaceuticals & Healthcare
- Drug Formulations
- Vaccines & Biologics
- Medical Devices & Diagnostics
- Building & Construction
- Architectural Coatings
- Wall paints and primers
- Waterproofing formulations
- Anti-corrosion coatings
- Industrial Coatings
- Automotive paints
- Protective coatings for machinery
- Anti-fouling marine coatings
- Printing Inks
- Packaging inks
- Textile printing formulations
- Conductive inks for electronics
- Agrochemicals
- Pesticides & Herbicides
- Solubilizers
- Adjuvants
- Fertilizers
- nutrient blends
- Adjuvants Chelating agents
- Seed Treatment
- seed coatings
- Fungicidal and insecticidal carriers
- Enhanced nutrient uptake agents
- Food & Beverages
- Extraction of Natural Ingredients
- Essential oils
- Flavors
- colors
- Beverage Formulations
- Solubilizers
- Carriers for vitamins and supplements
- Stabilizers in emulsions and syrups
- Food Preservation
- Antimicrobial agents
- Moisture retention enhancers
- Packaging adhesives
- Electronics & Semiconductors
- Printed Circuit Board (PCB) Cleaning
- Removal of flux residues
- Surface preparation solvents
- High-purity cleaning agents
- Others
- Semiconductor Processing
- Photoresist stripping solvents
- Dielectric cleaning formulations
- Solvent carriers for doping agents
- Others
- Battery Manufacturing
- Electrolyte formulations
- Solvent carriers for active materials
- Stabilizers in lithium-based batteries
-
- Latin-America Distribution Channel Outlook (Revenue, USD Million; 2019-2032)
- Offline
- Distributors / Wholesalers
- Retail Stores
- Trade Fairs / Exhibitions / Conferences
- Online
- E-Commerce Platforms
- Manufacturer Websites
- Social Media & Influencer Marketing
- Digital B2B Marketplaces
- Brazil
- Brazil Green Solvent Market By Ingredient Outlook (Revenue, USD Million 2019-2032)
- Bio-Alcohols
- Ethanol
- Butanol
- Propanol
- Isopropanol
- Bio-Diols & Glycols
- Propylene glycol
- Butylene glycol
- Lactate Esters
- Ethyl lactate
- Butyl lactate
- Tarpenes
- D-Limonene
- Pinene
- Fatty Acid Esters
- Methyl soyate
- Ethyl oleate
- Water-Based Solvents
- Non-ionic surfactants
- Anionic surfactants
- Cationic surfactants
- Others
- Brazil Green Solvent Market By Source Outlook (Revenue, USD Million 2019-2032)
- Plant-Based
- Soybean oil derivatives
- Corn-based alcohols
- Citrus peel extracts
- Sugar-derived solvents
- Agricultural Waste
- Corn husks
- Rice bran oil
- Coconut shells
- Sugarcane bagasse
- Wheat straw
- Algae-Derived Solvents
- Microalgae lipid
- Marine algae bio-oils
- Omega-rich solvent
- Algae-Derived Solvents
- Microalgae lipid
- Marine algae bio-oils
- Omega-rich solvent
- Bioengineered
- Bio-butanol
- Bio-propylene glycol
- Bio-succinic acid
- Other
- Brazil Green Solvent Market By End Use Outlook (Revenue, USD Million 2019-2032)
- Personal Care & Cosmetics
- Skincare
- Lotions
- Gels
- Serums
- Others
- Hair Care
- Shampoos
- Conditioners
- hair oils
- Other
- Makeup
- Foundations
- Primers
- Concealers
- antioxidants
- Other
- Pharmaceuticals & Healthcare
- Drug Formulations
- Vaccines & Biologics
- Medical Devices & Diagnostics
- Building & Construction
- Architectural Coatings
- Wall paints and primers
- Waterproofing formulations
- Anti-corrosion coatings
- Industrial Coatings
- Automotive paints
- Protective coatings for machinery
- Anti-fouling marine coatings
- Printing Inks
- Packaging inks
- Textile printing formulations
- Conductive inks for electronics
- Agrochemicals
- Pesticides & Herbicides
- Solubilizers
- Adjuvants
- Fertilizers
- nutrient blends
- Adjuvants Chelating agents
- Seed Treatment
- seed coatings
- Fungicidal and insecticidal carriers
- Enhanced nutrient uptake agents
- Food & Beverages
- Extraction of Natural Ingredients
- Essential oils
- Flavors
- colors
- Beverage Formulations
- Solubilizers
- Carriers for vitamins and supplements
- Stabilizers in emulsions and syrups
- Food Preservation
- Antimicrobial agents
- Moisture retention enhancers
- Packaging adhesives
- Electronics & Semiconductors
- Printed Circuit Board (PCB) Cleaning
- Removal of flux residues
- Surface preparation solvents
- High-purity cleaning agents
- Others
- Semiconductor Processing
- Photoresist stripping solvents
- Dielectric cleaning formulations
- Solvent carriers for doping agents
- Others
- Battery Manufacturing
- Electrolyte formulations
- Solvent carriers for active materials
- Stabilizers in lithium-based batteries
-
- Brazil Distribution Channel Outlook (Revenue, USD Million; 2019-2032)
- Offline
- Distributors / Wholesalers
- Retail Stores
- Trade Fairs / Exhibitions / Conferences
- Online
- E-Commerce Platforms
- Manufacturer Websites
- Social Media & Influencer Marketing
- Digital B2B Marketplaces
- Rest of Latin America
- Rest of Latin America Green Solvent Market By Ingredient Outlook (Revenue, USD Million 2019-2032)
- Bio-Alcohols
- Ethanol
- Butanol
- Propanol
- Isopropanol
- Bio-Diols & Glycols
- Propylene glycol
- Butylene glycol
- Lactate Esters
- Ethyl lactate
- Butyl lactate
- Tarpenes
- D-Limonene
- Pinene
- Fatty Acid Esters
- Methyl soyate
- Ethyl oleate
- Water-Based Solvents
- Non-ionic surfactants
- Anionic surfactants
- Cationic surfactants
- Others
- Rest of Latin America Green Solvent Market By Source Outlook (Revenue, USD Million 2019-2032)
- Plant-Based
- Soybean oil derivatives
- Corn-based alcohols
- Citrus peel extracts
- Sugar-derived solvents
- Agricultural Waste
- Corn husks
- Rice bran oil
- Coconut shells
- Sugarcane bagasse
- Wheat straw
- Algae-Derived Solvents
- Microalgae lipid
- Marine algae bio-oils
- Omega-rich solvent
- Algae-Derived Solvents
- Microalgae lipid
- Marine algae bio-oils
- Omega-rich solvent
- Bioengineered
- Bio-butanol
- Bio-propylene glycol
- Bio-succinic acid
- Other
- Rest of Latin America Green Solvent Market By End Use Outlook (Revenue, USD Million 2019-2032)
- Personal Care & Cosmetics
- Skincare
- Lotions
- Gels
- Serums
- Others
- Hair Care
- Shampoos
- Conditioners
- hair oils
- Other
- Makeup
- Foundations
- Primers
- Concealers
- antioxidants
- Other
- Pharmaceuticals & Healthcare
- Drug Formulations
- Vaccines & Biologics
- Medical Devices & Diagnostics
- Building & Construction
- Architectural Coatings
- Wall paints and primers
- Waterproofing formulations
- Anti-corrosion coatings
- Industrial Coatings
- Automotive paints
- Protective coatings for machinery
- Anti-fouling marine coatings
- Printing Inks
- Packaging inks
- Textile printing formulations
- Conductive inks for electronics
- Agrochemicals
- Pesticides & Herbicides
- Solubilizers
- Adjuvants
- Fertilizers
- nutrient blends
- Adjuvants Chelating agents
- Seed Treatment
- seed coatings
- Fungicidal and insecticidal carriers
- Enhanced nutrient uptake agents
- Food & Beverages
- Extraction of Natural Ingredients
- Essential oils
- Flavors
- colors
- Beverage Formulations
- Solubilizers
- Carriers for vitamins and supplements
- Stabilizers in emulsions and syrups
- Food Preservation
- Antimicrobial agents
- Moisture retention enhancers
- Packaging adhesives
- Electronics & Semiconductors
- Printed Circuit Board (PCB) Cleaning
- Removal of flux residues
- Surface preparation solvents
- High-purity cleaning agents
- Others
- Semiconductor Processing
- Photoresist stripping solvents
- Dielectric cleaning formulations
- Solvent carriers for doping agents
- Others
- Battery Manufacturing
- Electrolyte formulations
- Solvent carriers for active materials
- Stabilizers in lithium-based batteries
-
- Rest of Latin America Distribution Channel Outlook (Revenue, USD Million; 2019-2032)
- Offline
- Distributors / Wholesalers
- Retail Stores
- Trade Fairs / Exhibitions / Conferences
- Online
- E-Commerce Platforms
- Manufacturer Websites
- Social Media & Influencer Marketing
- Digital B2B Marketplaces
- Saudi Arabia
- Saudi Arabia Green Solvent Market By Ingredient Outlook (Revenue, USD Million 2019-2032)
- Bio-Alcohols
- Ethanol
- Butanol
- Propanol
- Isopropanol
- Bio-Diols & Glycols
- Propylene glycol
- Butylene glycol
- Lactate Esters
- Ethyl lactate
- Butyl lactate
- Tarpenes
- D-Limonene
- Pinene
- Fatty Acid Esters
- Methyl soyate
- Ethyl oleate
- Water-Based Solvents
- Non-ionic surfactants
- Anionic surfactants
- Cationic surfactants
- Others
- Saudi Arabia Green Solvent Market By Source Outlook (Revenue, USD Million 2019-2032)
- Plant-Based
- Soybean oil derivatives
- Corn-based alcohols
- Citrus peel extracts
- Sugar-derived solvents
- Agricultural Waste
- Corn husks
- Rice bran oil
- Coconut shells
- Sugarcane bagasse
- Wheat straw
- Algae-Derived Solvents
- Microalgae lipid
- Marine algae bio-oils
- Omega-rich solvent
- Algae-Derived Solvents
- Microalgae lipid
- Marine algae bio-oils
- Omega-rich solvent
- Bioengineered
- Bio-butanol
- Bio-propylene glycol
- Bio-succinic acid
- Other
- Saudi Arabia America Green Solvent Market By End Use Outlook (Revenue, USD Million 2019-2032)
- Personal Care & Cosmetics
- Skincare
- Lotions
- Gels
- Serums
- Others
- Hair Care
- Shampoos
- Conditioners
- hair oils
- Other
- Makeup
- Foundations
- Primers
- Concealers
- antioxidants
- Other
- Pharmaceuticals & Healthcare
- Drug Formulations
- Vaccines & Biologics
- Medical Devices & Diagnostics
- Building & Construction
- Architectural Coatings
- Wall paints and primers
- Waterproofing formulations
- Anti-corrosion coatings
- Industrial Coatings
- Automotive paints
- Protective coatings for machinery
- Anti-fouling marine coatings
- Printing Inks
- Packaging inks
- Textile printing formulations
- Conductive inks for electronics
- Agrochemicals
- Pesticides & Herbicides
- Solubilizers
- Adjuvants
- Fertilizers
- nutrient blends
- Adjuvants Chelating agents
- Seed Treatment
- seed coatings
- Fungicidal and insecticidal carriers
- Enhanced nutrient uptake agents
- Food & Beverages
- Extraction of Natural Ingredients
- Essential oils
- Flavors
- colors
- Beverage Formulations
- Solubilizers
- Carriers for vitamins and supplements
- Stabilizers in emulsions and syrups
- Food Preservation
- Antimicrobial agents
- Moisture retention enhancers
- Packaging adhesives
- Electronics & Semiconductors
- Printed Circuit Board (PCB) Cleaning
- Removal of flux residues
- Surface preparation solvents
- High-purity cleaning agents
- Others
- Semiconductor Processing
- Photoresist stripping solvents
- Dielectric cleaning formulations
- Solvent carriers for doping agents
- Others
- Battery Manufacturing
- Electrolyte formulations
- Solvent carriers for active materials
- Stabilizers in lithium-based batteries
-
- Saudi Arabia Distribution Channel Outlook (Revenue, USD Million; 2019-2032)
- Offline
- Distributors / Wholesalers
- Retail Stores
- Trade Fairs / Exhibitions / Conferences
- Online
- E-Commerce Platforms
- Manufacturer Websites
- Social Media & Influencer Marketing
- Digital B2B Marketplaces
- Rest of Middle East & Africa
- Rest of Middle East & Africa Solvent Market By Ingredient Outlook (Revenue, USD Million 2019-2032)
- Bio-Alcohols
- Ethanol
- Butanol
- Propanol
- Isopropanol
- Bio-Diols & Glycols
- Propylene glycol
- Butylene glycol
- Lactate Esters
- Ethyl lactate
- Butyl lactate
- Tarpenes
- D-Limonene
- Pinene
- Fatty Acid Esters
- Methyl soyate
- Ethyl oleate
- Water-Based Solvents
- Non-ionic surfactants
- Anionic surfactants
- Cationic surfactants
- Others
- Rest of Middle East & Africa Solvent Market By Source Outlook (Revenue, USD Million 2019-2032)
- Plant-Based
- Soybean oil derivatives
- Corn-based alcohols
- Citrus peel extracts
- Sugar-derived solvents
- Agricultural Waste
- Corn husks
- Rice bran oil
- Coconut shells
- Sugarcane bagasse
- Wheat straw
- Algae-Derived Solvents
- Microalgae lipid
- Marine algae bio-oils
- Omega-rich solvent
- Algae-Derived Solvents
- Microalgae lipid
- Marine algae bio-oils
- Omega-rich solvent
- Bioengineered
- Bio-butanol
- Bio-propylene glycol
- Bio-succinic acid
- Other
- Rest of Middle East & Africa Green Solvent Market By End Use Outlook (Revenue, USD Million 2019-2032)
- Personal Care & Cosmetics
- Skincare
- Lotions
- Gels
- Serums
- Others
- Hair Care
- Shampoos
- Conditioners
- hair oils
- Other
- Makeup
- Foundations
- Primers
- Concealers
- antioxidants
- Other
- Pharmaceuticals & Healthcare
- Drug Formulations
- Vaccines & Biologics
- Medical Devices & Diagnostics
- Building & Construction
- Architectural Coatings
- Wall paints and primers
- Waterproofing formulations
- Anti-corrosion coatings
- Industrial Coatings
- Automotive paints
- Protective coatings for machinery
- Anti-fouling marine coatings
- Printing Inks
- Packaging inks
- Textile printing formulations
- Conductive inks for electronics
- Agrochemicals
- Pesticides & Herbicides
- Solubilizers
- Adjuvants
- Fertilizers
- nutrient blends
- Adjuvants Chelating agents
- Seed Treatment
- seed coatings
- Fungicidal and insecticidal carriers
- Enhanced nutrient uptake agents
- Food & Beverages
- Extraction of Natural Ingredients
- Essential oils
- Flavors
- colors
- Beverage Formulations
- Solubilizers
- Carriers for vitamins and supplements
- Stabilizers in emulsions and syrups
- Food Preservation
- Antimicrobial agents
- Moisture retention enhancers
- Packaging adhesives
- Electronics & Semiconductors
- Printed Circuit Board (PCB) Cleaning
- Removal of flux residues
- Surface preparation solvents
- High-purity cleaning agents
- Others
- Semiconductor Processing
- Photoresist stripping solvents
- Dielectric cleaning formulations
- Solvent carriers for doping agents
- Others
- Battery Manufacturing
- Electrolyte formulations
- Solvent carriers for active materials
- Stabilizers in lithium-based batteries
-
- Rest of Middle East & Africa Channel Outlook (Revenue, USD Million; 2019-2032)
- Offline
- Distributors / Wholesalers
- Retail Stores
- Trade Fairs / Exhibitions / Conferences
- Online
- E-Commerce Platforms
- Manufacturer Websites
- Social Media & Influencer Marketing
- Digital B2B Marketplaces