Market Synopsis
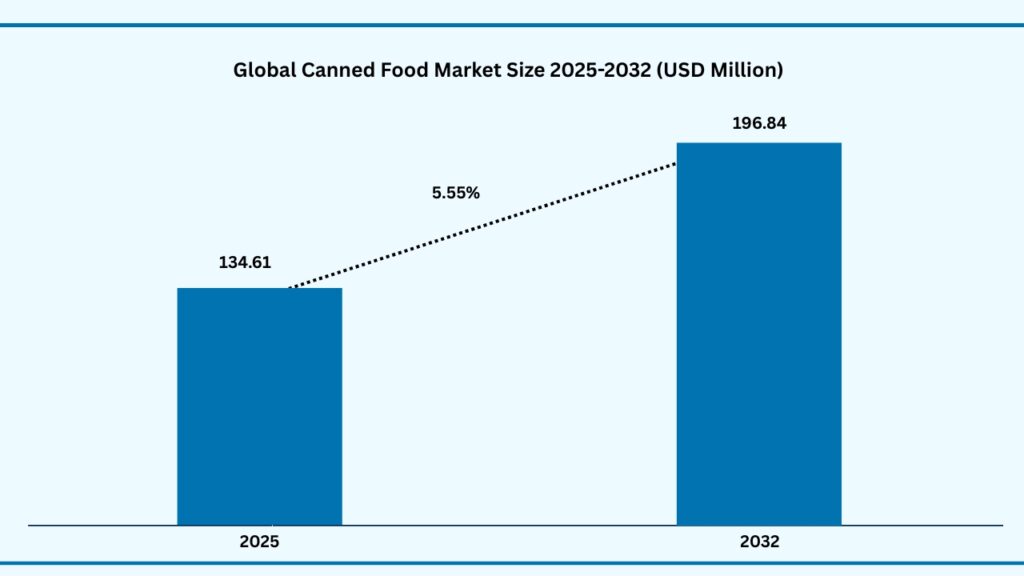
The global canned food market size was USD 127.76 Billion in 2024 and is expected to reach USD 196.84 billion at a CAGR of 5.55% during the forecast period. Revenue growth is being driven by increasing global demand for convenient and long-shelf-life food products, expanding urban populations with busy lifestyles, rising adoption of ready-to-eat meals, and strong growth in online and offline retail channels. Additionally, innovations in packaging and preservation technologies, the introduction of healthier and organic canned food options, and heightened consumer focus on food security and reduced waste are expected to further accelerate market expansion. The global canned food market is benefiting from multiple structural and consumer-driven trends that support long-term growth. With over 56% of the world’s population now living in urban areas (World Bank, 2024), busier lifestyles and reduced cooking time are fueling demand for ready-to-eat and long-shelf-life products. Consumers are increasingly attracted to the convenience, portability, and reliability of canned foods, especially in regions where fresh supply chains are less developed.
Global Canned Food Market (USD Million)
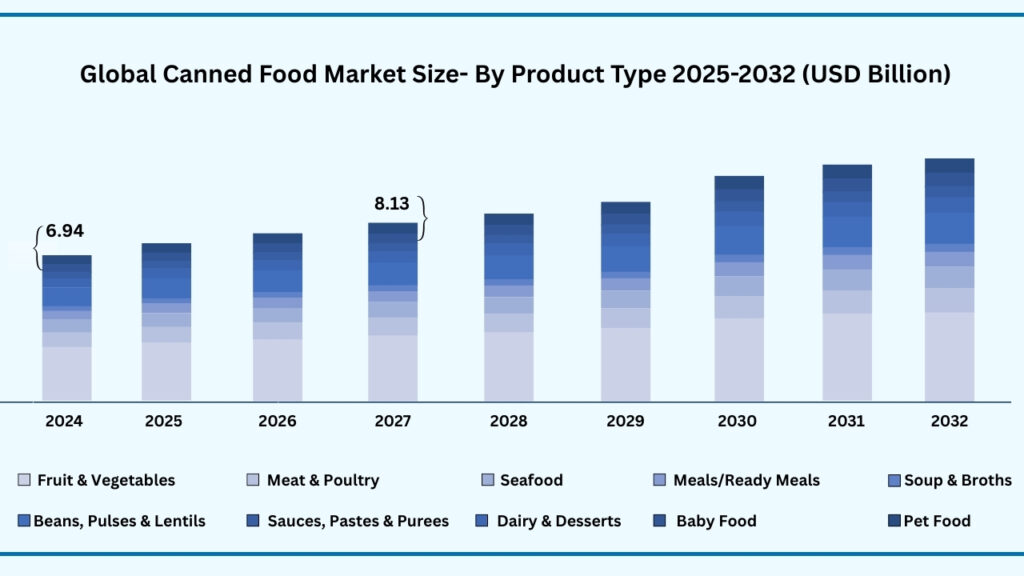
Global Canned Food Market By Product Type Insights:
Fruits and vegetables segment accounted for market share of share 29.24% in 2024 in the global canned food market.
The fruits and vegetables segment accounted for the largest share of the global canned food market in 2024, representing 29.24% of total revenues. Fruits and vegetables segment is expected to register a CAGR of 5.57% during the forecast year from 2024 to 2032 and expected to reach USD 57.65 billion in 2032. The This dominance is driven by the category’s ability to provide year-round availability and food security, ensuring a steady supply of produce regardless of season or location. Urban households increasingly favor canned fruits and vegetables for their convenience, long shelf life, and reliability, while foodservice operators value their consistency in quality and pricing. In regions with limited cold-chain infrastructure, these products also serve as a vital alternative to fresh produce imports.
Leading players are actively investing to strengthen their positions in this segment. Del Monte Foods has upgraded canning technology in the U.S. and Asia to improve freshness retention and expand its organic offerings, while Bonduelle has introduced premium canned vegetables with reduced sodium and recyclable packaging to target health-conscious consumers. Dole Packaged Foods has increased fruit canning capacity in the Philippines to meet export demand in North America and Europe, and Kraft Heinz has scaled up production of canned tomato products in Italy for global pasta sauce markets. Similarly, Greenyard Foods has expanded its partnerships with European retailers to develop private-label canned vegetable lines, enhancing retail penetration and brand visibility worldwide.
Global Canned Food Market by Product Type (USD Billion)
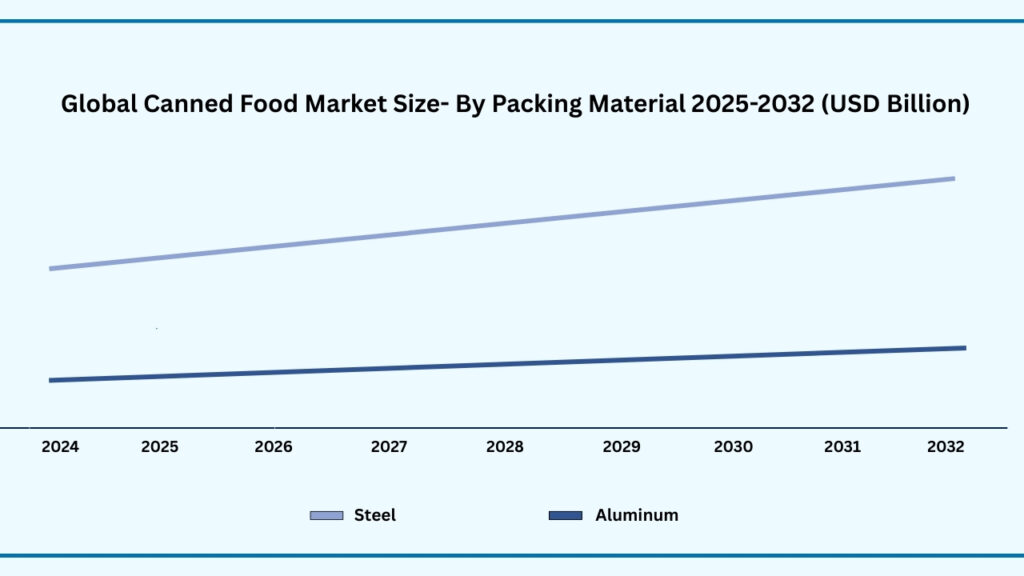
Global Canned Food Market by Packaging Material Insights:
Steel segment accounted for the largest market share of share 72.24% in 2024 in the global canned food market.
Based on the packaging material, the global canned food market is segmented into steel and aluminium. Among these, the canned segment held the largest revenue share of 72.24% 2024, and expected to register a CAGR of 5.56% between 2024 to 2032 and the market is expected to reach USD 142.31 billion by 2032. The segment dominance is primarily due to steel’s superior durability, strength, and ability to withstand high processing temperatures, making it ideal for preserving a wide range of food products — from vegetables, fruits, and seafood to ready meals and pet food. Steel cans offer exceptional barrier protection against light, oxygen, and contaminants, ensuring long shelf life and maintaining product quality over extended periods.
The material’s cost-effectiveness and recyclability have also contributed to its widespread adoption. Steel is one of the most recycled packaging materials globally, with a recycling rate of over 75% in many regions, which aligns well with rising consumer and regulatory demands for sustainable packaging. Additionally, advancements in tinplate coating and lightweight steel manufacturing have reduced material usage without compromising strength, enabling manufacturers to lower production and transportation costs while enhancing environmental performance.
Global Canned Food Market by Packaging Material (USD Billion)
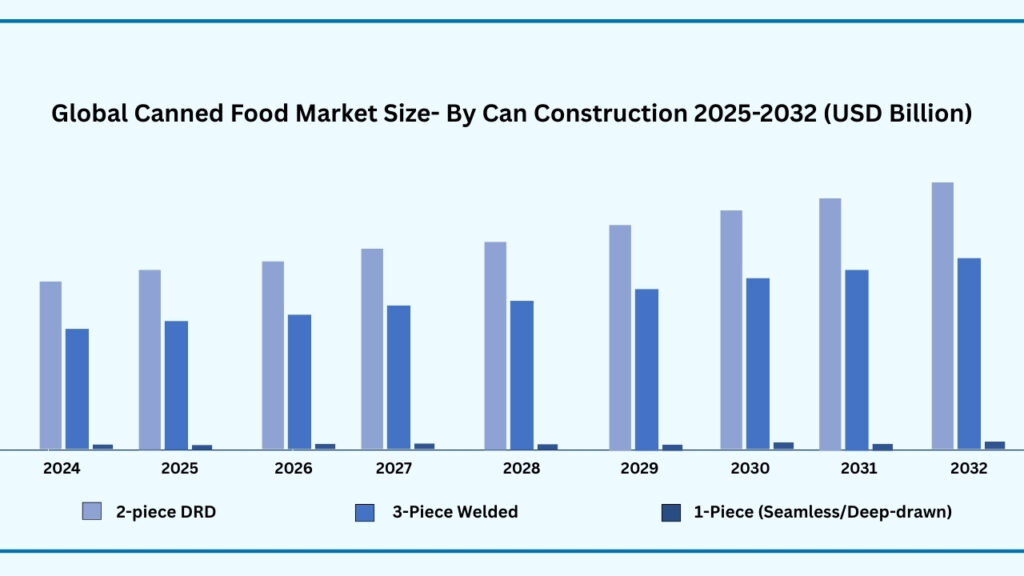
Global Canned Food Market by Can Construction Insights:
2-piece DRD segment accounted for the largest market share of share 56.35% in 2024 in the global canned food market.
Based on can construction, the global canned food market is segmented into 2-piece DRD, 3-piece welded and 1-Piece (Seamless/Deep-drawn). Among these, the 2-piece DRD segment held the largest revenue share of 56.35% in the global canned food market in 2024 and expected to register a CAGR of 5.59% from 2024 to 2032. This growth is largely driven by the segment’s superior manufacturing efficiency and product integrity. Unlike 3-piece welded cans, the 2-piece DRD design is made from a single sheet of metal, eliminating the need for side seams and reducing potential leakage points. This seamless construction enhances the can’s strength, improves its barrier properties, and provides better protection against contamination, making it especially suitable for high-acid foods such as tomatoes, fruit juices, and ready meals.
The segment’s popularity is also supported by its lighter weight and aesthetic appeal. DRD cans can be manufactured with thinner walls without sacrificing durability, reducing material costs and improving transportation efficiency. Their smooth, continuous surface allows for high-quality printing and labelling, which enhances shelf appeal and supports premium branding strategies. The ability to withstand high retort processing temperatures without deformation further increases their suitability for a wide range of canned products, from seafood and meat to soups and sauces.
Sustainability considerations are playing an increasingly important role in the segment’s expansion. The 2-piece DRD manufacturing process generates less waste compared to traditional methods, and the cans are fully recyclable, aligning with both corporate sustainability commitments and tightening global packaging regulations. Leading canned food manufacturers are investing in high-speed DRD production lines to increase capacity and reduce unit costs, while also adopting BPA-free linings to address consumer health concerns. These combined advantages — performance, cost efficiency, visual appeal, and sustainability — are ensuring that 2-piece DRD cans remain the preferred choice for many large-scale food producers worldwide.
Global Canned Food Market by Can Construction (USD Billion)
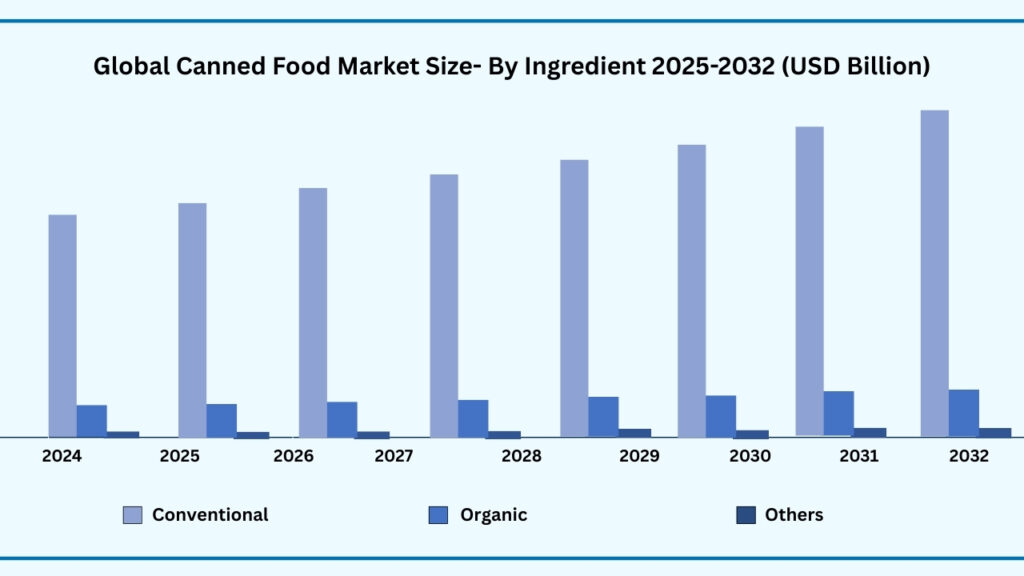
Global Canned Food Market by ingredient Insights:
Conventional segment accounted for the largest market share of share 86.25% in 2024 in the global canned food market.
Based on ingredient, the global canned food market is segmented into Conventional, Organic, and Others. Among these, Conventional segment held the largest revenue share of 86.25% in the global canned food market in 2024 and expected to register a CAGR of 5.53% from 2024 to 2032 and the conventional segment is expected to reach USD 169.56 billion. This dominance is primarily due to the wide availability and lower production cost of conventionally grown fruits, vegetables, seafood, and meats compared to organic alternatives. Conventional ingredients allow manufacturers to produce canned products at price points accessible to a broader consumer base, particularly in emerging markets where affordability remains a primary purchase driver. Additionally, the global middle-class population is expanding rapidly, and cost-effective canned goods offer an attractive balance between nutrition, convenience, and value.
The segment’s growth is also supported by strong retail penetration and robust supply chain infrastructure. Conventional ingredients are produced at scale, ensuring consistent quality and year-round availability across multiple geographies. This reliability is crucial for large-scale canned food manufacturers who supply both domestic and export markets. Furthermore, conventional farming practices often result in higher yields per acre, which supports stable pricing and enables mass production to meet rising global demand for ready-to-eat, long-shelf-life food products. The versatility of conventional ingredients also allows them to be used across a diverse range of canned categories, from soups and sauces to pet food and bakery fillings, ensuring steady demand across multiple consumer segments.
In addition, ongoing innovations in preservation techniques and canning processes are improving the nutritional retention and taste profile of conventionally sourced products, further boosting consumer acceptance. Many leading manufacturers are also diversifying conventional product lines with low-sodium, fortified, and clean-label offerings to appeal to health-conscious shoppers while keeping prices competitive. As inflationary pressures and global food security concerns persist, the conventional ingredient segment is well-positioned to maintain its dominance, offering both economic efficiency for producers and accessible nutrition for consumers worldwide.
Global Canned Food Market by Ingredient (USD Billion)
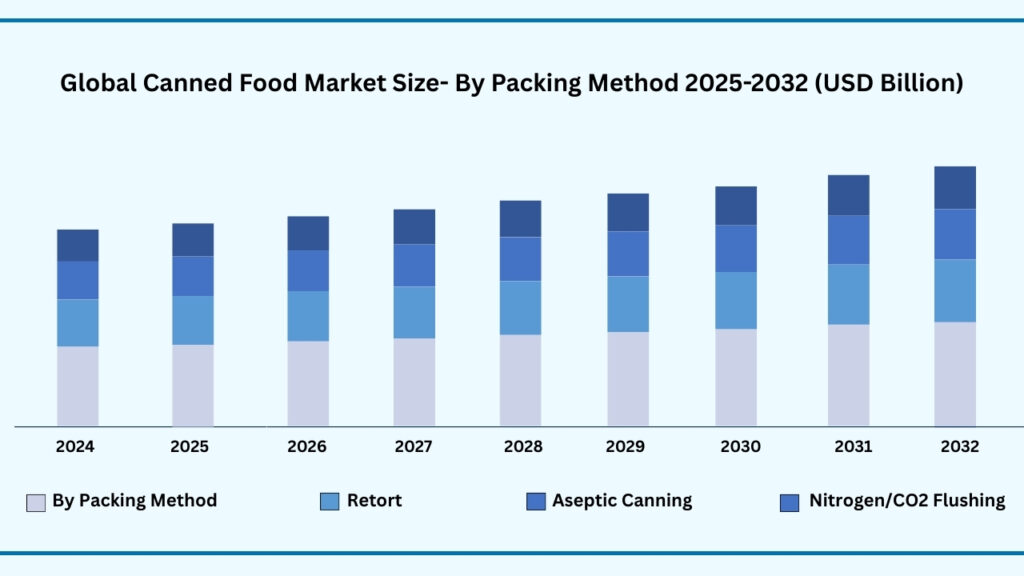
Global Canned Food Market by Packaging Method:
Retort segment accounted for the largest market share of share 39.23% in 2024 in the global canned food market.
Based on packaging method, the global canned food market is segmented into Retort, Aseptic canning and Nitrogen/CO2. Among these, Retort segment held the largest revenue share of 39.23% in the global canned food market in 2024 and expected to register a CAGR of 5.58% from 2024 to 2032 and the Retort segment is expected to reach USD 77.12 billion in 2032. Its dominance stems from its proven ability to ensure long shelf life while maintaining the safety and quality of canned products. Retort processing uses high-temperature, high-pressure sterilization to eliminate microorganisms and enzymes that cause spoilage, making it suitable for a wide range of food categories including soups, sauces, seafood, meats, and ready meals. This method is particularly valued in both developed and developing markets for its ability to keep products safe and stable without refrigeration, supporting global food security and export trade.
The segment’s growth is further supported by its compatibility with both traditional metal cans and modern flexible pouches or trays, offering versatility for manufacturers seeking to diversify their packaging formats. Retort technology allows for large-scale production at high speeds, reducing per-unit costs and meeting the demands of mass-market distribution. Additionally, the process is highly reliable in preserving the original taste, texture, and nutritional value of food, which has helped overcome consumer concerns about canned products being overly processed. The method’s suitability for both low-acid and high-acid foods also expands its applications across diverse product categories.
Global Canned Food Market by Packaging Method (USD Billion)
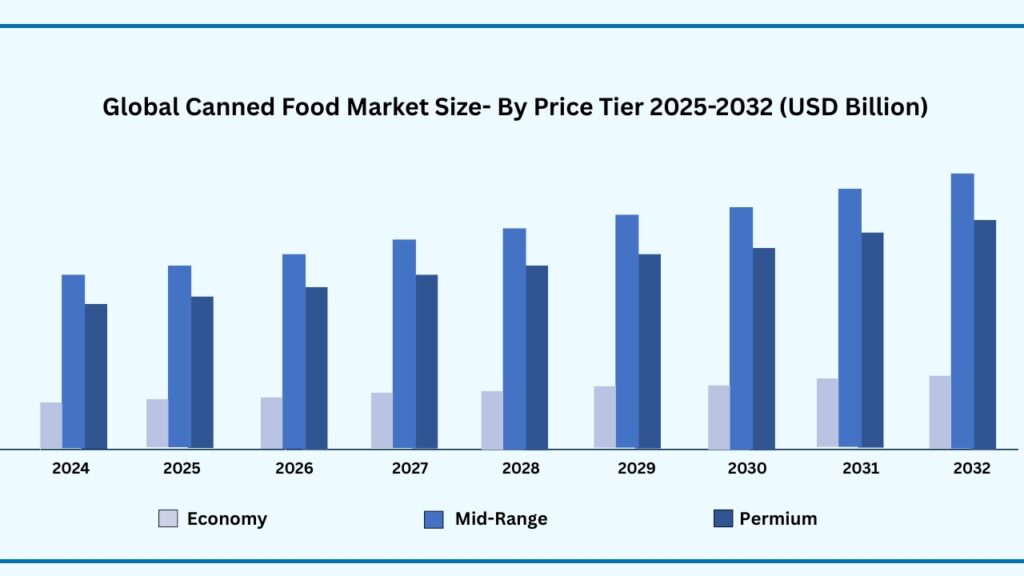
Global Canned Food Market by Price Tier:
Mid-Range segment accounted for the largest market share of share 48.21% in 2024 in the global canned food market.
Based on price tier segment, the global canned food market is segmented into Economy, Mid-range and Premium. Among these, Mid-range segment held the largest revenue share of 48.23% in the global canned food market in 2024 and expected to register a CAGR of 5.51% from 2024 to 2032 and mid-range segment is expected to reach USD 94.63 billion in 2032. This dominance is primarily driven by its ability to balance affordability and quality, appealing to the largest portion of the global consumer base — the growing middle class. Mid-range canned food products offer better taste, nutritional value, and packaging quality compared to economy-tier products, while remaining more accessible than premium offerings. This makes them the preferred choice for households seeking consistent quality without overspending, particularly in emerging markets where disposable incomes are steadily rising.
The segment also benefits from strong penetration in modern retail and e-commerce channels, where mid-range brands dominate shelf space and online listings due to their popularity and high turnover rates. These products often include established national and international brands that have earned consumer trust through decades of consistent quality, which encourages repeat purchases. Furthermore, mid-range pricing allows manufacturers to incorporate moderate levels of innovation — such as reduced sodium content, fortified nutrition, or eco-friendly packaging — without pushing the price beyond the reach of mass-market consumers.
Global consumption patterns also favor mid-range canned goods in both developed and developing economies. In developed markets, consumers often choose mid-range products as everyday staples while reserving premium items for special occasions. In developing markets, improving purchasing power and urbanization are expanding the customer base for higher-quality yet affordable canned foods. Additionally, foodservice operators such as restaurants, cafes, and catering services frequently opt for mid-range canned ingredients, as they provide consistent quality at manageable costs. These combined factors ensure that the mid-range price tier will continue to be the most influential segment in driving overall market growth.
Global Canned Food Market by Price Tier (USD Billion)
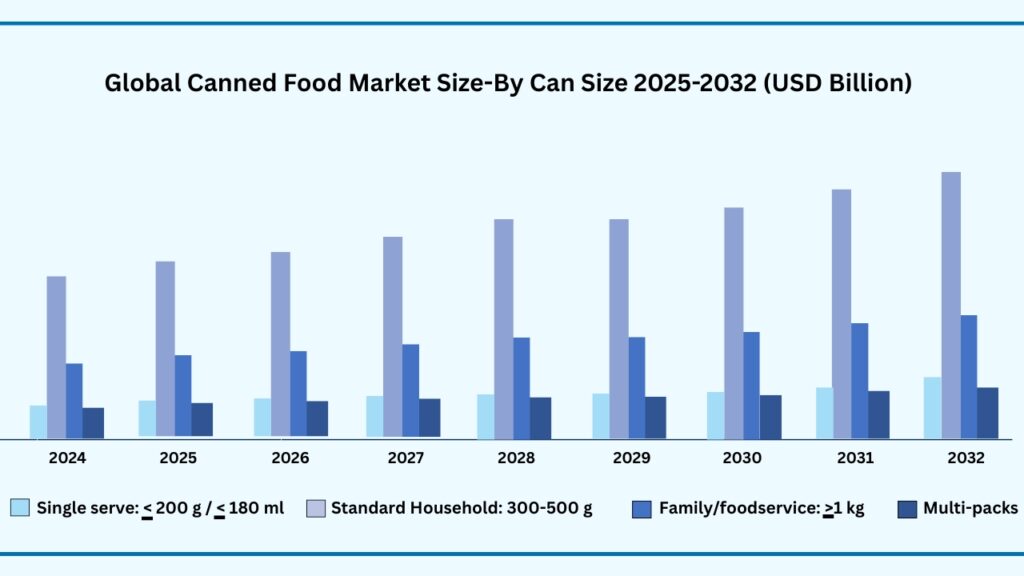
Global Canned Food Market by Can Size:
Standard household: 300–500 segment accounted for the largest market share of share 51.24% in 2024 in the global canned food market.
Based on can size, the global canned food market is segmented into Single-serve: ≤200 g / ≤180 ml, Standard household: 300–500 g., Family/foodservice: ≥1 kg, and multi-packs. Amongst these, Standard household: 300–500 g segment held the largest revenue share of 51.24% in the global canned food market in 2024 and expected to register a CAGR of 5.52% from 2024 to 2032. his size range is considered the most versatile for everyday consumption, offering the ideal balance between portion size and storage convenience for small to medium-sized households. It is widely used across multiple product categories — including vegetables, fruits, seafood, soups, sauces, and ready meals — making it a universal format in both developed and emerging markets. Consumers favor this size as it typically serves two to four portions, reducing waste while ensuring cost-effectiveness.
The segment’s dominance is further supported by its strong availability in supermarkets, hypermarkets, and online platforms, where it is often positioned as the standard retail pack size. Manufacturers prefer the 300–500 g format because it offers optimal product visibility, easy handling, and efficient space utilization during transportation and shelf stocking. This size also aligns well with consumer shopping habits, as it fits neatly into pantry storage and provides enough quantity for meal preparation without requiring refrigeration for leftovers. Foodservice operators, particularly small cafes and catering services, also use this size for dishes that require consistent ingredient measurements.
Growing global demand for convenience foods is adding momentum to this segment, especially in urban areas where smaller households and busy work schedules drive preference for quick, ready-to-use meal components. The format’s cost-to-value ratio appeals to middle-income consumers, while its suitability for both single-product purchases and multi-pack promotions makes it attractive for retailers. As manufacturers continue to introduce healthier, organic, and gourmet options in the standard household size, the segment is expected to maintain its leadership position in the canned food market over the forecast period.
Global Canned Food Market by Can Size (USD Billion)
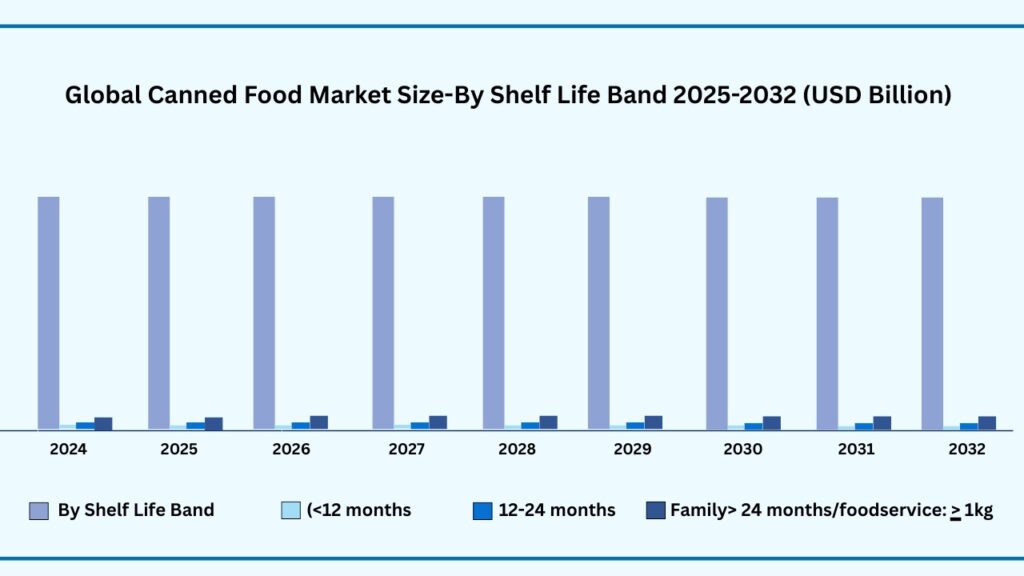
Global Canned Food Market by Shelf-Life Band:
Family>24 months/foodservice: ≥1 kg accounted for the largest market share of share 68.34% in 2024 in the global canned food market.
Based on shelf-life band, the global canned food market is segmented into (<12 months, 12–24 months, and Family>24 months/foodservice: ≥1 kg. Amongst these, Family>24 months/foodservice: ≥1 kg segment held the largest revenue share of 68.34% in the global canned food market in 2024 and expected to register a CAGR of 5.56% from 2024 to 2032. This dominance is primarily due to its suitability for bulk consumption in both household and commercial settings. A shelf life exceeding two years offers significant advantages in terms of storage flexibility, inventory management, and product availability, making it highly attractive to foodservice operators, institutional buyers, and large families. These long-lasting products are particularly valuable in regions with limited access to fresh food supply chains or in areas prone to seasonal disruptions.
The segment’s growth is also supported by its critical role in global trade and export markets. Products with a shelf life beyond 24 months can withstand extended shipping times without compromising quality, making them a preferred choice for international distribution. In the foodservice sector, bulk canned goods — such as vegetables, sauces, meat, and seafood — allow restaurants, hotels, and catering businesses to maintain consistent menu offerings while reducing procurement frequency and operational costs. Governments and humanitarian organizations also stockpile these long-shelf-life products for disaster relief, military use, and emergency food reserves, further boosting demand.
Additionally, advancements in canning technology and packaging materials have enhanced the quality, nutritional retention, and flavor stability of products stored for extended periods. This has helped overcome consumer perceptions that long-shelf-life canned goods are lower in quality compared to fresher alternatives. As global concerns about food security, inflation, and supply chain disruptions persist, demand for products that offer both durability and value is expected to remain strong. These factors collectively ensure that the Family >24 months / Foodservice segment will continue to dominate the canned food market in the years ahead.
Global Canned Food Market by Shelf Life Band (USD Billion)
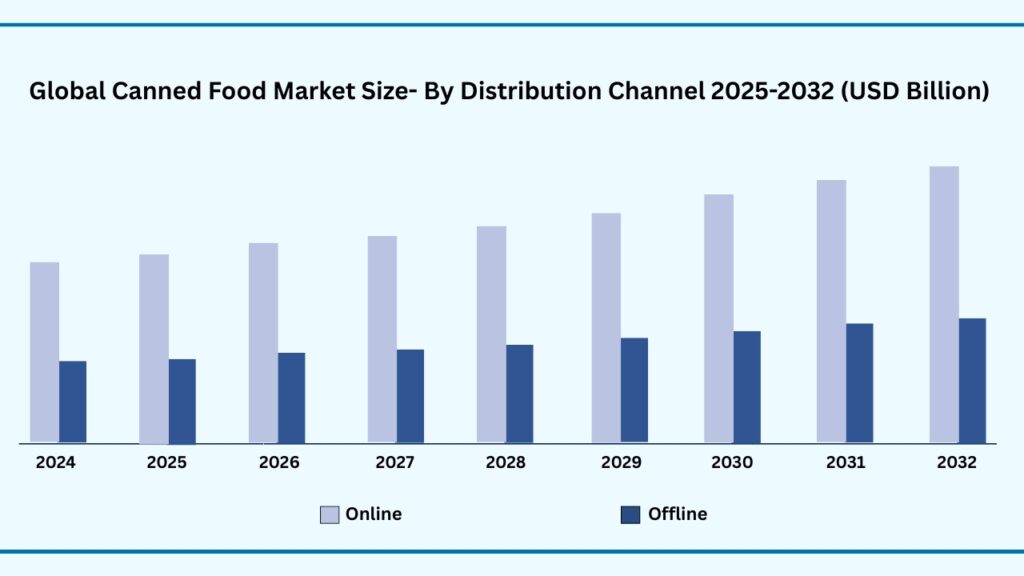
Global Canned Food Market by Distribution Channel:
Online segment accounted for the largest market share of share 69.24% in 2024 in the global canned food market.
Based on distribution channel, the global canned food market is segmented online & offline segment. Online segment held the largest revenue share of 69.24% in the global canned food market in 2024 and expected to register a CAGR of 5.53% from 2024 to 2032. This dominance is driven by the rapid global expansion of e-commerce grocery platforms and the increasing consumer preference for convenient, doorstep delivery services. The nature of canned food — with its long shelf life, durability during transit, and standardized packaging — makes it particularly well-suited for online retail. Consumers can easily compare prices, explore a wider range of brands, and access specialty or imported canned products that may not be available in local offline stores.
The segment’s growth is also supported by aggressive digital marketing campaigns, subscription-based grocery delivery services, and the integration of AI-driven recommendation systems by leading e-commerce platforms. Online retailers often offer bundled discounts, flash sales, and loyalty programs that incentivize bulk purchases of canned goods. Furthermore, the COVID-19 pandemic permanently altered shopping habits, with many consumers retaining the convenience of online grocery purchases even after restrictions eased. In emerging markets, improved internet penetration, mobile payment adoption, and same-day delivery options have further accelerated online sales of canned food.
Additionally, the online channel allows manufacturers and brands to directly engage with consumers through dedicated brand stores, influencer marketing, and product education content, which boosts brand loyalty. It also facilitates access to niche segments, such as organic canned products or gourmet imports, catering to health-conscious and premium shoppers. As global e-commerce infrastructure continues to improve and consumer trust in online food purchases strengthens, the online distribution channel is expected to maintain its leadership position in the canned food market throughout the forecast period.
Global Canned Food Market by Distribution Channel (USD Billion)
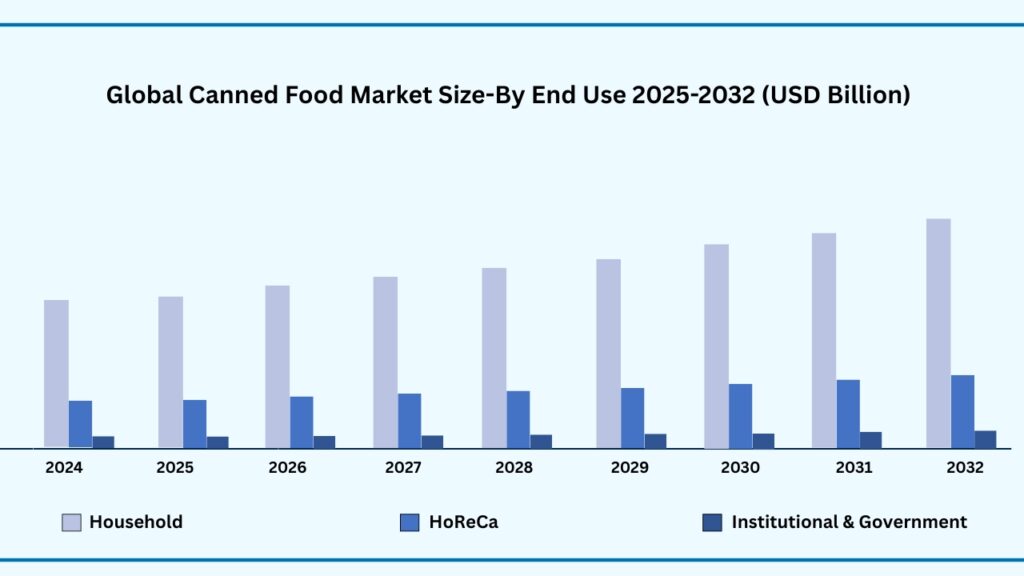
Global Canned Food Market by End Use:
Household segment accounted for the largest market share of share 65.24% in 2024 in the global canned food market.
Based on end use segment, the global canned food market is segmented by Household, HoReCa, and Institutional & Government. Household segment held the largest revenue share of 65.24% in the global canned food market in 2024 and expected to register a CAGR of 5.45% from 2024 to 2032. This dominance is driven by the increasing consumer preference for ready-to-eat and ready-to-cook products that save time and reduce meal preparation efforts. Busy lifestyles, urbanization, and the growing participation of women in the workforce have significantly boosted household consumption of canned foods. Additionally, rising disposable incomes in developing economies have made packaged convenience foods more accessible to middle-class households.
The long shelf life and minimal storage requirements of canned food make it particularly attractive to households, especially in regions where cold storage capacity is limited. Canned vegetables, fruits, meats, seafood, and soups are often purchased in bulk for weekly or monthly consumption, reducing frequent grocery trips. The segment also benefits from product diversification — with healthier, low-sodium, preservative-free, and organic canned options gaining popularity among health-conscious families. Marketing strategies that promote canned food as a nutritious, safe, and affordable alternative to fresh produce have further increased household adoption.
Moreover, changing consumer habits since the COVID-19 pandemic have reinforced stockpiling and pantry-loading behaviors, keeping household demand strong. E-commerce grocery platforms have made it easier for households to access a wider variety of canned products, including international and specialty brands. Seasonal promotions, multi-pack offers, and private label expansions by supermarkets have also played a crucial role in boosting household consumption. With the combination of convenience, affordability, and product variety, the household segment is expected to remain the largest end-use category in the global canned food market throughout the forecast period.
Global Canned Food Market by End Use (USD Billion)
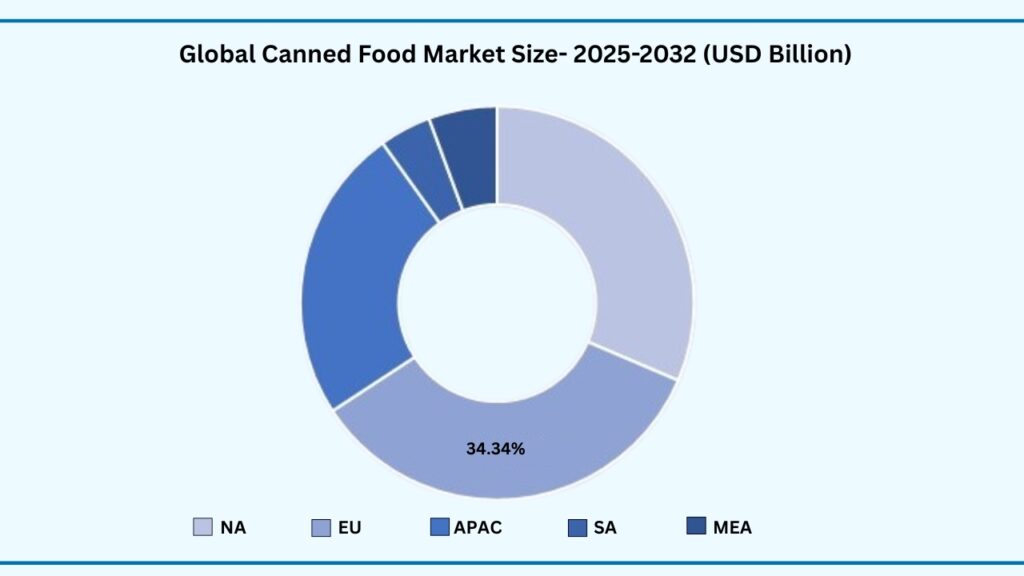
Global Canned Food Market by Region:
Europe Region accounted for the largest market share of share 34.34% in 2024 in the global canned food market.
Based on region, the global canned food market is segmented by Asia-Pacific, Europe, North America, Middle East & Africa and Latin America. Europe region held the largest revenue share of 34.34% in the global canned food market in 2024 and expected to register a CAGR of 5.56% from 2024 to 2032.
he region’s leadership is primarily attributed to its long-standing consumer culture of using canned food as a staple, supported by well-established preservation and packaging industries. European households have a high adoption rate of canned vegetables, fruits, seafood, and ready meals, owing to busy urban lifestyles and a strong preference for convenience. Moreover, the presence of leading global canned food brands and advanced manufacturing facilities in countries such as Germany, the UK, France, Spain, and Italy ensures a consistent supply of high-quality products.
Sustainability initiatives and innovations in metal packaging have also contributed to the segment’s growth in Europe. Consumers in the region are increasingly environmentally conscious, driving demand for recyclable steel and aluminum cans. European manufacturers have responded by introducing BPA-free linings, reduced material usage, and improved recycling systems, aligning with EU circular economy policies. Furthermore, stringent food safety regulations, such as EFSA guidelines, ensure high product quality and consumer trust, reinforcing the demand for canned foods in the market.
The growth is also supported by strong retail infrastructure, with supermarkets, hypermarkets, and online platforms offering an extensive range of canned products. Seasonal weather variations in Europe, especially the long winters in Northern and Eastern Europe, make canned foods an essential part of household storage for year-round access to fruits, vegetables, and seafood. Additionally, the popularity of premium and gourmet canned foods — such as artisanal seafood, organic soups, and Mediterranean preserved vegetables — is expanding the market’s value segment. Together, these factors position Europe as the leading regional market for canned food, with steady growth expected through 2032.
Global Canned Food Market by Region (Usd Billion)
Major Companies and Competitive Landscape
The global canned food market is fragmented, with large and medium-sized players accounting for the majority of market revenue. Major companies are adopting various strategies, including mergers and acquisitions, strategic agreements and partnerships, and the development, testing, and launch of innovative canned food products. These efforts aim to enhance product quality, extend shelf life, improve sustainability, and cater to evolving consumer preferences. Some of the leading companies profiled in the global canned food market report include:
- Conagra Brands, Inc.
- Kraft Heinz Company
- Campbell Soup Company
- The Kraft Heinz Company
- Del Monte Foods, Inc.
- Hormel Foods Corporation
- Thai Union Group PCL
- Dole Food Company, Inc.
- Bonduelle SA
- Bumble Bee Foods
- General Mills, Inc.
- Nestlé S.A.
- Princes Group
- AYAM Brand
- Ocean Brands GP
- Bolton Group
- Herbert Inwald GmbH & Co. KG
- Lassonde Industries Inc.
- Ravi Foods Pvt. Ltd.
- Ahi Guven Canned Food Co.
- H.J. Heinz Company Australia Ltd.
- Rhodes Food Group
- Golden Circle Pty Ltd.
- Truong Giang Joint Stock Company
- Grupo Calvo
- Century Pacific Food, Inc.
Strategic Development
Conagra Brands: Portfolio Modernization & Strategic Divestment
Conagra Brands’ decision to eliminate all certified FD&C artificial colors from its U.S. frozen food portfolio by 2025 and extend this reform across all retail products by 2027 reflects a broader shift toward clean-label, health-focused offerings that is directly influencing the canned food market This strategy is expected to boost consumer trust and demand for canned products by aligning with growing preferences for natural, preservative-free foods, particularly among millennials and Gen Z. By divesting non-core brands and reallocating resources toward innovation in nutrient-rich, reformulated canned vegetables and meals, Conagra is not only meeting stricter nutritional standards but also positioning itself for premium pricing and stronger brand loyalty. These efforts set a competitive benchmark in the global canned food market, enabling the company to capture health-conscious consumers, enhance retail shelf appeal, and secure long-term revenue growth in a category historically driven by price sensitivity.
Scope of Research
| Report Details | Outcome |
|---|---|
| Market size in 2024 | USD 127.76 Billion |
| CAGR (2024–2032) | 5.55% |
| Revenue forecast to 2033 | USD 196.84 Billion |
| Base year for estimation | 2024 |
| Historical data | 2019–2023 |
| Forecast period | 2025–2032 |
| Quantitative units | Revenue in USD Billion, Volume in Kilotons and CAGR in % from 2024 to 2032 |
| Report coverage | Revenue forecast, company ranking, competitive landscape, growth factors, and trends |
| Segments covered | Product Type, By Packaging Material, By Can Construction, By Ingredient, By Packaging Method, By Price Tier, By Can Size, By Shelf-Life Band, By Distribution Channel, By End Use and By region. |
| Regional scope | North America, Europe, Asia Pacific, Latin America, Middle East & Africa |
| Country scope | U.S., Canada, Mexico, Germany, France, U.K., Italy, Spain, Benelux, Russia, Finland, Sweden, Rest of Europe, China, India, Japan, South Korea, Indonesia, Thailand, Vietnam, Australia, New Zealand Rest of APAC, Brazil, Rest of LATAM, Saudi Arabia, UAE, South Africa, Turkey, Rest of MEA |
| Key companies profiled | Conagra Brands, Inc., Kraft Heinz Company, Campbell Soup Company, The Kraft Heinz Company, Del Monte Foods, Inc., Hormel Foods Corporation, Thai Union Group PCL, Dole Food Company, Inc., Bonduelle SA, Bumble Bee Foods, General Mills, Inc., Nestlé S.A., Princes Group, AYAM Brand, Ocean Brands GP, Bolton Group, Herbert Inwald GmbH & Co. KG, Lassonde Industries Inc., Ravi Foods Pvt. Ltd., Ahi Guven Canned Food Co., H.J. Heinz Company Australia Ltd., Rhodes Food Group, Golden Circle Pty Ltd., Truong Giang Joint Stock Company, Grupo Calvo, Century Pacific Food, Inc. |
| Customization scope | 10 hours of free customization and expert consultation |
Some Key Questions the Report Will Answer
- What is the expected revenue Compound Annual Growth Rate (CAGR) of the global canned food market over the forecast period (2024–2032)?
- The global canned food market revenue is expected to register a Compound Annual Growth Rate (CAGR) of 5.55% during the forecast period.
- What was the size of the global canned market in 2024?
- The global canned food market size was USD 127.76 Billion in 2024.
- Which factors are expected to drive the canned food market growth?
- Increasing consumer demand for convenient and ready-to-eat meals, rising urbanization and busy lifestyles, growing popularity of long-shelf-life food products, and expanding retail and e-commerce distribution channels are key factors driving revenue growth of the global canned food market. Additionally, innovations in canning technology, improved preservation techniques, and the rising adoption of healthier, organic, and sustainably sourced canned products are further boosting market expansion.
- Which was the leading segment in the global canned market in terms of product type in 2024?
- Fruits & Vegetables segment was leading in the canned food market on the basis of type in 2024.
- What are some restraints for revenue growth of the global canned market?
- Rising consumer preference for fresh and minimally processed foods, growing awareness about the nutritional loss associated with high-heat canning processes, and concerns over BPA and other chemicals in can linings are restraining the revenue growth of the global canned food market. Additionally, increasing competition from alternative packaging formats such as frozen, vacuum-packed, and ready-to-cook products, coupled with fluctuating raw material and metal packaging costs, is creating challenges for manufacturers. Environmental concerns related to metal waste and recycling inefficiencies also limit market expansion.
Chapter 1. Introduction
1.1. Market Definition
1.2. Objectives of the study
1.3. Overview of canned food market
1.4. Currency and pricing
1.5. Limitation
1.6. Markets covered
1.7. Research Scope
Chapter 2. Research Methodology
2.1. Research Sources
2.1.1.Primary
2.1.2.Secondary
2.1.3.Paid Sources
2.2. Years considered for the study
2.3. Assumptions
2.3.1.Market value
2.3.2.Market volume
2.3.3.Exchange rate
2.3.4.Price
2.3.5.Economic & political stability
Chapter 3. Executive Summary
3.1. Summary Snapshot, 2024–2032
Chapter 4. Key Insights
4.1. Production consumption analysis
4.2. Strategic partnerships & alliances
4.3. Joint ventures
4.4. Acquisition of local players
4.5. Contract manufacturing
4.6. Digital & e-commerce sales channels
4.7. Compliance with standards
4.8. Value chain analysis
4.9. Raw material sourcing
4.10. Formulation & manufacturing
4.11. Distribution & retail4.12.Import-export analysis
4.13. Brand comparative analysis
4.14. Technological advancements
4.15. Porter’s five force
4.15.1. Threat of new entrants
4.15.1.1. Capital requirment
4.15.1.2. Product knowledge
4.15.1.3. Technical knowledge
4.15.1.4. Customer relation
4.15.1.5. Access to appliation and technology
4.15.2. Threat of substitutes
4.15.2.1. Cost
4.15.2.2. Performance
4.15.2.3. Availability
4.15.2.4. Technical knowledge
4.15.2.5. Durability
4.15.3. Bargainning power of buyers
4.15.3.1. Numbers of buyers relative to suppliers
4.15.3.2. Product differentiation
4.15.3.3. Threat of forward integration
4.15.3.4. Buyers volume
4.15.4. Bargainning power of suppliers
4.15.4.1. Suppliers concentration
4.15.4.2. Buyers switching cost to other suppliers
4.15.4.3. Threat of backward integration
4.15.5. Bargainning power of suppliers
4.15.5.1. Industry concentration
4.15.5.2. Industry growth rate
4.15.5.3. Product differentiation
4.15.6. Patent analysis
4.16.Patent quality and strength
4.17.Regulation coverage
4.18.Pricing analysis
4.19.Competitive Metric Space Analysis
Chapter 5. Market Overview
5.1. Drivers
5.1.1.Rising demand for convenient and ready-to-eat meals
5.1.2.Long shelf life and food preservation benefits
5.1.3.Expanding distribution channels
5.2. Restraints
5.2.1.Health concerns over preservatives and additives
5.2.2.Environmental concerns related to packaging waste
5.3. Opportunities
5.3.1.Growing demand for plant-based and organic canned foods
5.3.2.Innovation in sustainable packaging
5.3.3.Expansion in emerging markets of Asia-Pacific region
5.4. Threat
5.4.1.Intense competition from fresh, frozen, and alternative packaged foods
5.4.2.Volatility in raw material and metal packaging prices
Chapter 6. Canned Food Market By Product Type Insights & Trends, Revenue (USD Billion),
Volume (Kilotons)
6.1. Product Type Dynamics & Market Share, 2024–2032
6.1.1.Fruits & Vegetables
6.1.2. Meat & Poultry
6.1.3.Dairy & Desserts
Chapter 7. Canned Food Market By Packaging Material Insights & Trends, Revenue (USD Billion),
Volume (Kilotons)
7.1. Packaging Material Dynamics & Market Share, 2024–2033
7.1.1.steel,
7.1.2.Aluminum
Chapter 8. Canned Food Market By Can Construction Insights & Trends, Revenue (USD Billion),
Volume (Kilotons)
8.1. Can Canstruction Dynamics & Market Share, 2024–2033
8.1.1.2-piece DRD,
8.1.2.3-piece welded
Chapter 9. Canned Food Market By Ingredient Insights & Trends, Revenue (USD Billion), Volume
(Kilotons)
9.1. Ingredient Dynamics & Market Share, 2024–2033
9.1.1.Conventional,
9.1.2.Organic
Chapter 10. Canned Food Market By Packaging Method Insights & Trends, Revenue (USD Billion),
Volume (Kilotons)
10.1. Packaging Method Dynamics & Market Share, 2024–2033
10.1.1. Conventional,
10.1.2. Organic
Chapter 11. Canned Food Market By Packaging Method Insights & Trends, Revenue (USD Billion),
Volume (Kilotons)
11.1. Packaging Metahod Dynamics & Market Share, 2024–2033
11.1.1. Retort,
11.1.2. Aseptic canning,
11.1.3. Nitrogen/CO₂ flushing
Chapter 12. Canned Food Market By Price Tier Insights & Trends, Revenue (USD Billion), Volume
(Kilotons)
12.1. Price Tier Dynamics & Market Share, 2024–2033
12.1.1. Economy
12.1.2. Mid-range
12.1.3. Premium
Chapter 13. Canned Food Market By Can Size Insights & Trends, Revenue (USD Billion), Volume
(Kilotons)
13.1. Can Size Dynamics & Market Share, 2024–2033
13.1.1. Single-serve: ≤200 g / ≤180 ml,
13.1.2. Standard household: 300–500 g,
13.1.3. Family/foodservice: ≥1 kg,
13.1.4. Multi-packs
Chapter 14. Canned Food Market By Shelf Life Band Insights & Trends, Revenue (USD Billion),
Volume (Kilotons)
14.1. Shelf Life Band Dynamics & Market Share, 2024–2033
14.1.1. <12 months,
14.1.2. 12–24 months
14.1.3. >24 months
Chapter 15. Canned Food Market By Distribution Channel Insights & Trends, Revenue (USD
Billion), Volume (Kilotons)
15.1. Distribution Channel Dynamics & Market Share, 2024–2033
15.1.1. Online
15.1.2. Offline
Chapter 16. Canned Food Market By End Use Insights & Trends, Revenue (USD Billion), Volume
(Kilotons)
16.1. End Use Dynamics & Market Share, 2024–2033
16.1.1. Household
16.1.2. HoReCa
16.1.3. Institutional & Government
Chapter 17. Canned Food Market Regional Outlook
17.1. Canned Food Market Share By Region, 2024–2033
17.2. North America
17.2.1. Market By ProductType, Market Estimates and Forecast, USD Billion, Kilotons
17.2.2. Fruits & Vegetables
17.2.3. Meat & Poultry
17.2.4. Dairy & Desserts
17.3. Market By Packaging Material, Market Estimates and Forecast, USD Billion, Kilotons
17.3.1. Steel
17.3.2. Aluminum
17.4. Market By Can Construction, Market Estimates and Forecast, USD Billion, Kilotons
17.4.1.2-piece DRD
17.4.2.3-piece welded
17.4.3.1-Piece (Seamless/Deep-drawn)
17.5. Market By ingredient, Market Estimates and Forecast, USD Billion, Kilotons
17.5.1. 2-Conventional
17.5.2. Organic
17.5.3. Other
17.6. Market By packaging method, Market Estimates and Forecast, USD Billion, Kilotons
17.6.1. Retort
17.6.2. Aseptic canning
17.6.3. Nitrogen/CO2 Flushing
17.7. Market By Price Tier, Market Estimates and Forecast, USD Billion, Kilotons
17.7.1. Economy
17.7.2. Mid-range
17.7.3. Premium
17.8. Market By Can Size, Market Estimates and Forecast, USD Billion, Kilotons
17.8.1. Single-serve: ≤200 g / ≤180 ml
17.8.2. Standard household: 300–500 g
17.8.3. Family/foodservice: ≥1 kg
17.8.4. Multi-packs
17.9. Market By Shelf Life Band, Market Estimates and Forecast, USD Billion, Kilotons
17.9.1. (<12 months
17.9.2. 12–24 months
17.9.3. Family>24 months/foodservice: ≥1 kg
17.10. Market By Distribution Channel, Market Estimates and Forecast, USD Billion, Kilotons
17.10.1. Online
17.10.2. Offline
17.11. Market By End Use, Market Estimates and Forecast, USD Billion, Kilotons
17.11.1. Household
17.11.2. HoReCa
17.11.3. Institutional & GovernmentOffline
17.12. Market By Country, Market Estimates and Forecast, USD Billion, Kilotons
17.12.1. US
17.12.2. Canada
17.12.3. Mexico
17.13. Europe
17.14. Market By ProductType, Market Estimates and Forecast, USD Billion, Kilotons
17.14.1. Fruits & Vegetables
17.14.2. Meat & Poultry
17.14.3. Dairy & Desserts
17.15. Market By Packaging Material, Market Estimates and Forecast, USD Billion, Kilotons
17.15.1. Steel
17.15.2. Aluminum
17.16. Market By Can Construction, Market Estimates and Forecast, USD Billion, Kilotons
17.16.1. 2-piece DRD
17.16.2. 3-piece welded
17.16.3. 1-Piece (Seamless/Deep-drawn)
17.17. Market By ingredient, Market Estimates and Forecast, USD Billion, Kilotons
17.17.1. 2-Conventional
17.17.2. Organic
17.17.3. Other
17.18. Market By packaging method, Market Estimates and Forecast, USD Billion, Kilotons
17.18.1. Retort
17.18.2. Aseptic canning
17.18.3. Nitrogen/CO2 Flushing
17.19. Market By Price Tier, Market Estimates and Forecast, USD Billion, Kilotons
17.19.1. Economy
17.19.2. Mid-range
17.19.3. Premium
17.20. Market By Can Size, Market Estimates and Forecast, USD Billion, Kilotons
17.20.1. Single-serve: ≤200 g / ≤180 ml
17.20.2. Standard household: 300–500 g
17.20.3. Family/foodservice: ≥1 kg
17.20.4. Multi-packs
17.21. Market By Shelf Life Band, Market Estimates and Forecast, USD Billion, Kilotons
17.21.1. (<12 months
17.21.2. 12–24 months
17.21.3. Family>24 months/foodservice: ≥1 kg
17.22. Market By Distribution Channel, Market Estimates and Forecast, USD Billion, Kilotons
17.22.1. Online
17.22.2. Offline
17.23. Market By End Use, Market Estimates and Forecast, USD Billion, Kilotons
17.23.1. Household
17.23.2. HoReCa
17.23.3. Institutional & GovernmentOffline
17.24. Market By Country, Market Estimates and Forecast, USD Billion, Kilotons
17.24.1. Germany
17.24.2. France
17.24.3. U.K
17.24.4. Italy
17.24.5. Spain
17.24.6. Benelux
17.24.7. Russia
17.24.8. Finland
17.24.9. Sweden
17.24.10. Rest Of Europe
17.25. Asia-Pacific
17.25.1. Market By ProductType, Market Estimates and Forecast, USD Billion, Kilotons
17.25.2. Fruits & Vegetables
17.25.3. Meat & Poultry
17.25.4. Dairy & Desserts
17.26. Market By Packaging Material, Market Estimates and Forecast, USD Billion, Kilotons
17.26.1. Steel
17.26.2. Aluminum
17.27. Market By Can Construction, Market Estimates and Forecast, USD Billion, Kilotons
17.27.1. 2-piece DRD
17.27.2. 3-piece welded
17.27.3. 1-Piece (Seamless/Deep-drawn)
17.28. Market By ingredient, Market Estimates and Forecast, USD Billion, Kilotons
17.28.1. 2-Conventional
17.28.2. Organic
17.28.3. Other
17.29. Market By packaging method, Market Estimates and Forecast, USD Billion, Kilotons
17.29.1. Retort
17.29.2. Aseptic canning
17.29.3. Nitrogen/CO2 Flushing
17.30. Market By Price Tier, Market Estimates and Forecast, USD Billion, Kilotons
17.30.1. Economy
17.30.2. Mid-range
17.30.3. Premium
17.31. Market By Can Size, Market Estimates and Forecast, USD Billion, Kilotons
17.31.1. Single-serve: ≤200 g / ≤180 ml
17.31.2. Standard household: 300–500 g
17.31.3. Family/foodservice: ≥1 kg
17.31.4. Multi-packs
17.32. Market By Shelf Life Band, Market Estimates and Forecast, USD Billion, Kilotons
17.32.1. (<12 months
17.32.2. 12–24 months
17.32.3. Family>24 months/foodservice: ≥1 kg
17.33. Market By Distribution Channel, Market Estimates and Forecast, USD Billion, Kilotons
17.33.1. Online
17.33.2. Offline
17.34. Market By End Use, Market Estimates and Forecast, USD Billion, Kilotons
17.34.1. Household
17.34.2. HoReCa
17.34.3. Institutional & GovernmentOffline
17.35. Market By Country, Market Estimates and Forecast, USD Billion, Kilotons
17.35.1.1.China
17.35.1.2.India
17.35.1.3.Japan
17.35.1.4.South Korea
17.35.1.5.Indonesia
17.35.1.6.Thailand
17.35.1.7.Vietnam
17.35.1.8.Australia
17.35.1.9.New Zeland
17.35.1.10. Rest of APAC
17.36. Latin America
17.36.1. Market By ProductType, Market Estimates and Forecast, USD Billion, Kilotons
17.36.2. Fruits & Vegetables
17.36.3. Meat & Poultry
17.36.4. Dairy & Desserts
17.37. Market By Packaging Material, Market Estimates and Forecast, USD Billion, Kilotons
17.37.1. Steel
17.37.2. Aluminum
17.38. Market By Can Construction, Market Estimates and Forecast, USD Billion, Kilotons
17.38.1. 2-piece DRD
17.38.2. 3-piece welded
17.38.3. 1-Piece (Seamless/Deep-drawn)
17.39. Market By ingredient, Market Estimates and Forecast, USD Billion, Kilotons
17.39.1. 2-Conventional
17.39.2. Organic
17.39.3. Other
17.40. Market By packaging method, Market Estimates and Forecast, USD Billion, Kilotons
17.40.1. Retort
17.40.2. Aseptic canning
17.40.3. Nitrogen/CO2 Flushing
17.41. Market By Price Tier, Market Estimates and Forecast, USD Billion, Kilotons
17.41.1. Economy
17.41.2. Mid-range
17.41.3. Premium
17.42. Market By Can Size, Market Estimates and Forecast, USD Billion, Kilotons
17.42.1. Single-serve: ≤200 g / ≤180 ml
17.42.2. Standard household: 300–500 g
17.42.3. Family/foodservice: ≥1 kg
17.42.4. Multi-packs
17.43. Market By Shelf Life Band, Market Estimates and Forecast, USD Billion, Kilotons
17.43.1. (<12 months
17.43.2. 12–24 months
17.43.3. Family>24 months/foodservice: ≥1 kg
17.44. Market By Distribution Channel, Market Estimates and Forecast, USD Billion, Kilotons
17.44.1. Online
17.44.2. Offline
17.45. Market By End Use, Market Estimates and Forecast, USD Billion, Kilotons
17.45.1. Household
17.45.2. HoReCa
17.45.3. Institutional & GovernmentOffline
17.46. Market By Country, Market Estimates and Forecast, USD Billion, Kilotons
17.46.1. Market By Country, Market Estimates and Forecast, USD Billion, Kilotons
17.46.1.1.Brazil
17.46.1.2.Rest of LATAM
17.47. Middle East & Africa
17.47.1. Market By ProductType, Market Estimates and Forecast, USD Billion, Kilotons
17.47.2. Fruits & Vegetables
17.47.3. Meat & Poultry
17.47.4. Dairy & Desserts
17.48. Market By Packaging Material, Market Estimates and Forecast, USD Billion, Kilotons
17.48.1. Steel
17.48.2. Aluminum
17.49. Market By Can Construction, Market Estimates and Forecast, USD Billion, Kilotons
17.49.1. 2-piece DRD
17.49.2. 3-piece welded
17.49.3. 1-Piece (Seamless/Deep-drawn)
17.50. Market By ingredient, Market Estimates and Forecast, USD Billion, Kilotons
17.50.1. 2-Conventional
17.50.2. Organic
17.50.3. Other
17.51. Market By packaging method, Market Estimates and Forecast, USD Billion, Kilotons
17.51.1. Retort
17.51.2. Aseptic canning
17.51.3. Nitrogen/CO2 Flushing
17.52. Market By Price Tier, Market Estimates and Forecast, USD Billion, Kilotons
17.52.1. Economy
17.52.2. Mid-range
17.52.3. Premium
17.53. Market By Can Size, Market Estimates and Forecast, USD Billion, Kilotons
17.53.1. Single-serve: ≤200 g / ≤180 ml
17.53.2. Standard household: 300–500 g
17.53.3. Family/foodservice: ≥1 kg
17.53.4. Multi-packs
17.54. Market By Shelf Life Band, Market Estimates and Forecast, USD Billion, Kilotons
17.54.1. (<12 months
17.54.2. 12–24 months
17.54.3. Family>24 months/foodservice: ≥1 kg
17.55. Market By Distribution Channel, Market Estimates and Forecast, USD Billion, Kilotons
17.55.1. Online
17.55.2. Offline
17.56. Market By End Use, Market Estimates and Forecast, USD Billion, Kilotons
17.56.1. Household
17.56.2. HoReCa
17.56.3. Institutional & GovernmentOffline
17.57. Market By Country, Market Estimates and Forecast, USD Billion, Kilotons
17.57.1. Market By Country, Market Estimates and Forecast, USD Billion, Kilotons
17.57.1.1.Saudi Arabia
17.57.1.2.UAE
17.57.1.3.South Africa
17.57.1.4.Rest of MEA
17.57.1.5.
Chapter 18. Competitive Landscape
18.1. Market Revenue Share By Manufacturers
18.2. Mergers & Acquisitions
18.3. Competitor’s Positioning
18.4. Strategy Benchmarking
18.5. Vendor Landscape
18.5.1. Distributors
18.5.1.1. North America
18.5.1.2. Europe
18.5.1.3. Asia Pacific
18.5.1.4. Middle East & Africa
18.5.1.5. Latin America
18.5.2. Others
Chapter 19. Company Profiles
19.1. Conagra Brands, Inc.,
19.1.1. Company Overview
19.1.2. Product & Service Offerings
19.1.3. Strategic Initiatives
19.1.4. Financials
19.1.5. Research Insights
19.2. Kraft Heinz Company
19.2.1. Company Overview
19.2.2. Product & Service Offerings
19.2.3. Strategic Initiatives
19.2.4. Financials
19.2.5. Research Insights
19.3. Campbell Soup Company
19.3.1. Company Overview
19.3.2. Product & Service Offerings
19.3.3. Strategic Initiatives
19.3.4. Financials
19.3.5. Research Insights
19.4. The Kraft Heinz Company
19.4.1. Company Overview
19.4.2. Product & Service Offerings
19.4.3. Strategic Initiatives
19.4.4. Financials
19.4.5. Research Insights
19.5. Del Monte Foods, Inc.,
19.5.1. Company Overview
19.5.2. Product & Service Offerings
19.5.3. Strategic Initiatives
19.5.4. Financials
19.5.5. Research Insights
19.6. Hormel Foods Corporation
19.6.1. Company Overview
19.6.2. Product & Service Offerings
19.6.3. Strategic Initiatives
19.6.4. Financials
19.6.5. Research Insights
19.7. Thai Union Group PCL
19.7.1. Company Overview
19.7.2. Product & Service Offerings
19.7.3. Strategic Initiatives
19.7.4. Financials
19.7.5. Conclusion
19.8. Dole Food Company
19.8.1. Company Overview
19.8.2. Product & Service Offerings
19.8.3. Strategic Initiatives
19.8.4. Financials
19.8.5. Conclusion
19.9. Bonduelle SA,
19.9.1. Company Overview
19.9.2. Product & Service Offerings
19.9.3. Strategic Initiatives
19.9.4. Financials
19.9.5. Conclusion
19.10. Bumble Bee Foods
19.10.1. Company Overview
19.10.2. Product & Service Offerings
19.10.3. Strategic Initiatives
19.10.4. Financials
19.10.5. Conclusion
19.11. General Mills, Inc.,
19.11.1. Company Overview
19.11.2. Product & Service Offerings
19.11.3. Strategic Initiatives
19.11.4. Financials
19.11.5. Conclusion
19.12. Nestlé S.A.,
19.12.1. Company Overview
19.12.2. Product & Service Offerings
19.12.3. Strategic Initiatives
19.12.4. Financials
19.12.5. Conclusion
19.13. Princes Group
19.13.1. Company Overview
19.13.2. Product & Service Offerings
19.13.3. Strategic Initiatives
19.13.4. Financials
19.13.5. Conclusion
19.14. AYAM Brand
19.14.1. Company Overview
19.14.2. Product & Service Offerings
19.14.3. Strategic Initiatives
19.14.4. Financials
19.14.5. Conclusion
19.15. Ocean Brands GP
19.15.1. Company Overview
19.15.2. Product & Service Offerings
19.15.3. Strategic Initiatives
19.15.4. Financials
19.15.5. Conclusion
19.16. Bolton Group
19.16.1. Company Overview
19.16.2. Product & Service Offerings
19.16.3. Strategic Initiatives
19.16.4. Financials
19.16.5. Conclusion
19.17. Herbert Inwald GmbH & Co. KG
19.17.1. Company Overview
19.17.2. Product & Service Offerings
19.17.3. Strategic Initiatives
19.17.4. Financials
19.17.5. Conclusion
19.18. Lassonde Industries Inc.,
19.18.1. Company Overview
19.18.2. Product & Service Offerings
19.18.3. Strategic Initiatives
19.18.4. Financials
19.18.5. Conclusion
19.19. Ravi Foods Pvt. Ltd.,
19.19.1. Company Overview
19.19.2. Product & Service Offerings
19.19.3. Strategic Initiatives
19.19.4. Financials
19.19.5. Conclusion
19.20. Ahi Guven Canned Food Co.,
19.20.1. Company Overview
19.20.2. Product & Service Offerings
19.20.3. Strategic Initiatives
19.20.4. Financials
19.20.5. Conclusion
19.21. H.J. Heinz Company Australia Ltd.,
19.21.1. Company Overview
19.21.2. Product & Service Offerings
19.21.3. Strategic Initiatives
19.21.4. Financials
19.21.5. Conclusion
19.22. Rhodes Food Group
19.22.1. Company Overview
19.22.2. Product & Service Offerings
19.22.3. Strategic Initiatives
19.22.4. Financials
19.22.5. Conclusion
19.23. Golden Circle Pty Ltd
19.23.1. Company Overview
19.23.2. Product & Service Offerings
19.23.3. Strategic Initiatives
19.23.4. Financials
19.23.5. Conclusion
19.24. Truong Giang Joint Stock Company
19.24.1. Company Overview
19.24.2. Product & Service Offerings
19.24.3. Strategic Initiatives
19.24.4. Financials
19.24.5. Conclusion
19.25. Grupo Calvo
19.25.1. Company Overview
19.25.2. Product & Service Offerings
19.25.3. Strategic Initiatives
19.25.4. Financials
19.25.5. Conclusion
Segments Covered in Report
For the purpose of this report, Advantia Business Consulting LLP. has segmented global canned food market on the basis of Product Type, By Packaging Material, By Can Construction, By Ingredient, By Packaging Method, By Price Tier, By Can Size, By Shelf-Life Band, By Distribution Channel, By End Use and By region for 2019 to 2032
- Global Product Type Outlook (Revenue, USD Billion, Volume, Kilotons; 2024-2032)
|
|
|
|
|
|
|
|
|
|
|
- Global Can Construction (Revenue, USD Billion, Volume, Kilotons; 2024-2032)
-
- Steel
-
- Aluminum
- Global Can Construction Outlook (Revenue, USD Billion, Volume, Kilotons; 2024-2032)
-
- 2-piece DRD
-
- 3-piece welded
-
- 1-Piece (Seamless/Deep-drawn)
- Global Ingredient Outlook (Revenue, USD Billion, Volume, Kilotons; 2024-2032)
|
|
|
- Global Packaging Method (Revenue, USD Billion, Volume, Kilotons; 2024-2032)
|
|
|
- Global Price Tier (Revenue, USD Billion, Volume, Kilotons; 2024-2032)
|
|
|
- Global Can Size (Revenue, USD Billion, Volume, Kilotons; 2024-2032)
|
|
|
- Global Shelf-Life Band (Revenue, USD Billion, Volume, Kilotons; 2024-2032)
|
|
|
- Global Distribution Channel (Revenue, USD Billion, Volume, Kilotons; 2024-2032)
|
|
- Global End Use (Revenue, USD Billion, Volume, Kilotons; 2024-2032)
|
|
- North America
- North America Product Type Outlook (Revenue, USD Billion, Volume, Kilotons; 2024-2032)
|
|
|
|
|
|
|
|
|
|
|
- North America Can Construction (Revenue, USD Billion, Volume, Kilotons; 2024-2032)
-
- Steel
-
- Aluminum
- North America Can Construction Outlook (Revenue, USD Billion, Volume, Kilotons; 2024-2032)
-
- 2-piece DRD
-
- 3-piece welded
-
- 1-Piece (Seamless/Deep-drawn)
- North America Ingredient Outlook (Revenue, USD Billion, Volume, Kilotons; 2024-2032)
|
|
|
- North America Packaging Method (Revenue, USD Billion, Volume, Kilotons; 2024-2032)
|
|
|
- North America Price Tier (Revenue, USD Billion, Volume, Kilotons; 2024-2032)
|
|
|
- North America Can Size (Revenue, USD Billion, Volume, Kilotons; 2024-2032)
|
|
|
- North America Shelf-Life Band (Revenue, USD Billion, Volume, Kilotons; 2024-2032)
|
|
|
- North America Distribution Channel (Revenue, USD Billion, Volume, Kilotons; 2024-2032)
|
|
- North America End Use (Revenue, USD Billion, Volume, Kilotons; 2024-2032)
|
|
- U.S
- U.S Product Type Outlook (Revenue, USD Billion, Volume, Kilotons; 2024-2032)
|
|
|
|
|
|
|
|
|
|
|
- U.S Can Construction (Revenue, USD Billion, Volume, Kilotons; 2024-2032)
-
- Steel
-
- Aluminum
- U.S Can Construction Outlook (Revenue, USD Billion, Volume, Kilotons; 2024-2032)
-
- 2-piece DRD
-
- 3-piece welded
-
- 1-Piece (Seamless/Deep-drawn)
- U.S Ingredient Outlook (Revenue, USD Billion, Volume, Kilotons; 2024-2032)
|
|
|
- U.S Packaging Method (Revenue, USD Billion, Volume, Kilotons; 2024-2032)
|
|
|
- U.S Price Tier (Revenue, USD Billion, Volume, Kilotons; 2024-2032)
|
|
|
- U.S Can Size (Revenue, USD Billion, Volume, Kilotons; 2024-2032)
|
|
|
- U.S Shelf-Life Band (Revenue, USD Billion, Volume, Kilotons; 2024-2032)
|
|
|
- U.S Distribution Channel (Revenue, USD Billion, Volume, Kilotons; 2024-2032)
|
|
- U.S End Use (Revenue, USD Billion, Volume, Kilotons; 2024-2032)
|
|
- Canada
- Canada Product Type Outlook (Revenue, USD Billion, Volume, Kilotons; 2024-2032)
|
|
|
|
|
|
|
|
|
|
|
- Canada Can Construction (Revenue, USD Billion, Volume, Kilotons; 2024-2032)
-
- Steel
-
- Aluminum
- Canada Can Construction Outlook (Revenue, USD Billion, Volume, Kilotons; 2024-2032)
-
- 2-piece DRD
-
- 3-piece welded
-
- 1-Piece (Seamless/Deep-drawn)
- Canada Ingredient Outlook (Revenue, USD Billion, Volume, Kilotons; 2024-2032)
|
|
|
- Canada Packaging Method (Revenue, USD Billion, Volume, Kilotons; 2024-2032)
|
|
|
- Canada Price Tier (Revenue, USD Billion, Volume, Kilotons; 2024-2032)
|
|
|
- Canada Can Size (Revenue, USD Billion, Volume, Kilotons; 2024-2032)
|
|
|
- Canada Shelf-Life Band (Revenue, USD Billion, Volume, Kilotons; 2024-2032)
|
|
|
- Canada Distribution Channel (Revenue, USD Billion, Volume, Kilotons; 2024-2032)
|
|
- Canada End Use (Revenue, USD Billion, Volume, Kilotons; 2024-2032)
|
|
- Mexico
- Mexico Product Type Outlook (Revenue, USD Billion, Volume, Kilotons; 2024-2032)
|
|
|
|
|
|
|
|
|
|
|
- Mexico Can Construction (Revenue, USD Billion, Volume, Kilotons; 2024-2032)
-
- Steel
-
- Aluminum
- Mexico Can Construction Outlook (Revenue, USD Billion, Volume, Kilotons; 2024-2032)
-
- 2-piece DRD
-
- 3-piece welded
-
- 1-Piece (Seamless/Deep-drawn)
- Mexico Ingredient Outlook (Revenue, USD Billion, Volume, Kilotons; 2024-2032)
|
|
|
- Mexico Packaging Method (Revenue, USD Billion, Volume, Kilotons; 2024-2032)
|
|
|
- Mexico Price Tier (Revenue, USD Billion, Volume, Kilotons; 2024-2032)
|
|
|
- Mexico Can Size (Revenue, USD Billion, Volume, Kilotons; 2024-2032)
|
|
|
- Mexico Shelf-Life Band (Revenue, USD Billion, Volume, Kilotons; 2024-2032)
|
|
|
- Mexico Distribution Channel (Revenue, USD Billion, Volume, Kilotons; 2024-2032)
|
|
- Mexico End Use (Revenue, USD Billion, Volume, Kilotons; 2024-2032)
|
|
- Mexico
- Europe Product Type Outlook (Revenue, USD Billion, Volume, Kilotons; 2024-2032)
|
|
|
|
|
|
|
|
|
|
|
- Europe Can Construction (Revenue, USD Billion, Volume, Kilotons; 2024-2032)
-
- Steel
-
- Aluminum
- Europe Can Construction Outlook (Revenue, USD Billion, Volume, Kilotons; 2024-2032)
-
- 2-piece DRD
-
- 3-piece welded
-
- 1-Piece (Seamless/Deep-drawn)
- Europe Ingredient Outlook (Revenue, USD Billion, Volume, Kilotons; 2024-2032)
|
|
|
- Europe Packaging Method (Revenue, USD Billion, Volume, Kilotons; 2024-2032)
|
|
|
- Europe Price Tier (Revenue, USD Billion, Volume, Kilotons; 2024-2032)
|
|
|
- Europe Can Size (Revenue, USD Billion, Volume, Kilotons; 2024-2032)
|
|
|
- Europe Shelf-Life Band (Revenue, USD Billion, Volume, Kilotons; 2024-2032)
|
|
|
- Europe Distribution Channel (Revenue, USD Billion, Volume, Kilotons; 2024-2032)
|
|
- Europe End Use (Revenue, USD Billion, Volume, Kilotons; 2024-2032)
|
|
- Germany
- Germany Product Type Outlook (Revenue, USD Billion, Volume, Kilotons; 2024-2032)
|
|
|
|
|
|
|
|
|
|
|
- Germany Can Construction (Revenue, USD Billion, Volume, Kilotons; 2024-2032)
-
- Steel
-
- Aluminum
- Germany Can Construction Outlook (Revenue, USD Billion, Volume, Kilotons; 2024-2032)
-
- 2-piece DRD
-
- 3-piece welded
-
- 1-Piece (Seamless/Deep-drawn)
- Germany Ingredient Outlook (Revenue, USD Billion, Volume, Kilotons; 2024-2032)
|
|
|
- Germany Packaging Method (Revenue, USD Billion, Volume, Kilotons; 2024-2032)
|
|
|
- Germany Price Tier (Revenue, USD Billion, Volume, Kilotons; 2024-2032)
|
|
|
- Germany Can Size (Revenue, USD Billion, Volume, Kilotons; 2024-2032)
|
|
|
- Germany Shelf-Life Band (Revenue, USD Billion, Volume, Kilotons; 2024-2032)
|
|
|
- Germany Distribution Channel (Revenue, USD Billion, Volume, Kilotons; 2024-2032)
|
|
- Germany End Use (Revenue, USD Billion, Volume, Kilotons; 2024-2032)
|
|
- France
- France Product Type Outlook (Revenue, USD Billion, Volume, Kilotons; 2024-2032)
|
|
|
|
|
|
|
|
|
|
|
- France Can Construction (Revenue, USD Billion, Volume, Kilotons; 2024-2032)
-
- Steel
-
- Aluminum
- France Can Construction Outlook (Revenue, USD Billion, Volume, Kilotons; 2024-2032)
-
- 2-piece DRD
-
- 3-piece welded
-
- 1-Piece (Seamless/Deep-drawn)
- France Ingredient Outlook (Revenue, USD Billion, Volume, Kilotons; 2024-2032)
|
|
|
- France Packaging Method (Revenue, USD Billion, Volume, Kilotons; 2024-2032)
|
|
|
- France Price Tier (Revenue, USD Billion, Volume, Kilotons; 2024-2032)
|
|
|
- France Can Size (Revenue, USD Billion, Volume, Kilotons; 2024-2032)
|
|
|
- France Shelf-Life Band (Revenue, USD Billion, Volume, Kilotons; 2024-2032)
|
|
|
- France Distribution Channel (Revenue, USD Billion, Volume, Kilotons; 2024-2032)
|
|
- France End Use (Revenue, USD Billion, Volume, Kilotons; 2024-2032)
|
|
- France
- U.K Product Type Outlook (Revenue, USD Billion, Volume, Kilotons; 2024-2032)
|
|
|
|
|
|
|
|
|
|
|
- U.K Can Construction (Revenue, USD Billion, Volume, Kilotons; 2024-2032)
-
- Steel
- Aluminum
- U.K Can Construction Outlook (Revenue, USD Billion, Volume, Kilotons; 2024-2032)
-
- 2-piece DRD
-
- 3-piece welded
-
- 1-Piece (Seamless/Deep-drawn)
- U.K Ingredient Outlook (Revenue, USD Billion, Volume, Kilotons; 2024-2032)
|
|
|
- U.K Packaging Method (Revenue, USD Billion, Volume, Kilotons; 2024-2032)
|
|
|
- U.K Price Tier (Revenue, USD Billion, Volume, Kilotons; 2024-2032)
|
|
|
- U.K Can Size (Revenue, USD Billion, Volume, Kilotons; 2024-2032)
|
|
|
- U.K Shelf-Life Band (Revenue, USD Billion, Volume, Kilotons; 2024-2032)
|
|
|
- U.K Distribution Channel (Revenue, USD Billion, Volume, Kilotons; 2024-2032)
|
|
- U.K End Use (Revenue, USD Billion, Volume, Kilotons; 2024-2032)
|
|
- Italy
- Italy Product Type Outlook (Revenue, USD Billion, Volume, Kilotons; 2024-2032)
|
|
|
|
|
|
|
|
|
|
|
- Italy Can Construction (Revenue, USD Billion, Volume, Kilotons; 2024-2032)
-
- Steel
-
- Aluminum
- Italy Can Construction Outlook (Revenue, USD Billion, Volume, Kilotons; 2024-2032)
-
- 2-piece DRD
-
- 3-piece welded
-
- 1-Piece (Seamless/Deep-drawn)
- Italy Ingredient Outlook (Revenue, USD Billion, Volume, Kilotons; 2024-2032)
|
|
|
- Italy Packaging Method (Revenue, USD Billion, Volume, Kilotons; 2024-2032)
|
|
|
- Italy Price Tier (Revenue, USD Billion, Volume, Kilotons; 2024-2032)
|
|
|
- Italy Can Size (Revenue, USD Billion, Volume, Kilotons; 2024-2032)
|
|
|
- U.K Shelf-Life Band (Revenue, USD Billion, Volume, Kilotons; 2024-2032)
|
|
|
- Italy Distribution Channel (Revenue, USD Billion, Volume, Kilotons; 2024-2032)
|
|
- Italy End Use (Revenue, USD Billion, Volume, Kilotons; 2024-2032)
|
|
- Spain
- Spain Product Type Outlook (Revenue, USD Billion, Volume, Kilotons; 2024-2032)
|
|
|
|
|
|
|
|
|
|
|
- Spain Can Construction (Revenue, USD Billion, Volume, Kilotons; 2024-2032)
-
- Steel
-
- Aluminum
- Spain Can Construction Outlook (Revenue, USD Billion, Volume, Kilotons; 2024-2032)
-
- 2-piece DRD
-
- 3-piece welded
-
- 1-Piece (Seamless/Deep-drawn)
- Spain Ingredient Outlook (Revenue, USD Billion, Volume, Kilotons; 2024-2032)
|
|
|
- Spain Packaging Method (Revenue, USD Billion, Volume, Kilotons; 2024-2032)
|
|
|
- Spain Price Tier (Revenue, USD Billion, Volume, Kilotons; 2024-2032)
|
|
|
- Spain Can Size (Revenue, USD Billion, Volume, Kilotons; 2024-2032)
|
|
|
- Spain Shelf-Life Band (Revenue, USD Billion, Volume, Kilotons; 2024-2032)
|
|
|
- Spain Distribution Channel (Revenue, USD Billion, Volume, Kilotons; 2024-2032)
|
|
- Spain End Use (Revenue, USD Billion, Volume, Kilotons; 2024-2032)
|
|
- Benelux
- Benelux Product Type Outlook (Revenue, USD Billion, Volume, Kilotons; 2024-2032)
|
|
|
|
|
|
|
|
|
|
|
- Benelux Can Construction (Revenue, USD Billion, Volume, Kilotons; 2024-2032)
-
- Steel
-
- Aluminum
- Benelux Can Construction Outlook (Revenue, USD Billion, Volume, Kilotons; 2024-2032)
-
- 2-piece DRD
-
- 3-piece welded
-
- 1-Piece (Seamless/Deep-drawn)
- Benelux Ingredient Outlook (Revenue, USD Billion, Volume, Kilotons; 2024-2032)
|
|
|
- Benelux Packaging Method (Revenue, USD Billion, Volume, Kilotons; 2024-2032)
|
|
|
- Benelux Price Tier (Revenue, USD Billion, Volume, Kilotons; 2024-2032)
|
|
|
- Benelux Can Size (Revenue, USD Billion, Volume, Kilotons; 2024-2032)
|
|
|
- Benelux Shelf-Life Band (Revenue, USD Billion, Volume, Kilotons; 2024-2032)
|
|
|
- Benelux Distribution Channel (Revenue, USD Billion, Volume, Kilotons; 2024-2032)
|
|
- Benelux End Use (Revenue, USD Billion, Volume, Kilotons; 2024-2032)
|
|
- Russia
- Russia Product Type Outlook (Revenue, USD Billion, Volume, Kilotons; 2024-2032)
|
|
|
|
|
|
|
|
|
|
|
- Russia Can Construction (Revenue, USD Billion, Volume, Kilotons; 2024-2032)
-
- Steel
-
- Aluminum
- Russia Can Construction Outlook (Revenue, USD Billion, Volume, Kilotons; 2024-2032)
-
- 2-piece DRD
-
- 3-piece welded
-
- 1-Piece (Seamless/Deep-drawn)
- Russia Ingredient Outlook (Revenue, USD Billion, Volume, Kilotons; 2024-2032)
|
|
|
- Russia Packaging Method (Revenue, USD Billion, Volume, Kilotons; 2024-2032)
|
|
|
- Russia Price Tier (Revenue, USD Billion, Volume, Kilotons; 2024-2032)
|
|
|
- Russia Can Size (Revenue, USD Billion, Volume, Kilotons; 2024-2032)
|
|
|
- Russia Shelf-Life Band (Revenue, USD Billion, Volume, Kilotons; 2024-2032)
|
|
|
- Russia Distribution Channel (Revenue, USD Billion, Volume, Kilotons; 2024-2032)
|
|
- Russia End Use (Revenue, USD Billion, Volume, Kilotons; 2024-2032)
|
|
- Finland
- Finland Product Type Outlook (Revenue, USD Billion, Volume, Kilotons; 2024-2032)
|
|
|
|
|
|
|
|
|
|
|
- Finland Can Construction (Revenue, USD Billion, Volume, Kilotons; 2024-2032)
-
- Steel
-
- Aluminum
- Finland Can Construction Outlook (Revenue, USD Billion, Volume, Kilotons; 2024-2032)
-
- 2-piece DRD
-
- 3-piece welded
-
- 1-Piece (Seamless/Deep-drawn)
- Finland Ingredient Outlook (Revenue, USD Billion, Volume, Kilotons; 2024-2032)
|
|
|
- Finland Packaging Method (Revenue, USD Billion, Volume, Kilotons; 2024-2032)
|
|
|
- Finland Price Tier (Revenue, USD Billion, Volume, Kilotons; 2024-2032)
|
|
|
- Finland Can Size (Revenue, USD Billion, Volume, Kilotons; 2024-2032)
|
|
|
- Finland Shelf-Life Band (Revenue, USD Billion, Volume, Kilotons; 2024-2032)
|
|
|
- Finland Distribution Channel (Revenue, USD Billion, Volume, Kilotons; 2024-2032)
|
|
- Finland End Use (Revenue, USD Billion, Volume, Kilotons; 2024-2032)
|
|
- Sweden
- Sweden Product Type Outlook (Revenue, USD Billion, Volume, Kilotons; 2024-2032)
|
|
|
|
|
|
|
|
|
|
|
- Sweden Can Construction (Revenue, USD Billion, Volume, Kilotons; 2024-2032)
-
- Steel
-
- Aluminum
- Sweden Can Construction Outlook (Revenue, USD Billion, Volume, Kilotons; 2024-2032)
-
- 2-piece DRD
-
- 3-piece welded
-
- 1-Piece (Seamless/Deep-drawn)
- Sweden Ingredient Outlook (Revenue, USD Billion, Volume, Kilotons; 2024-2032)
|
|
|
- Sweden Packaging Method (Revenue, USD Billion, Volume, Kilotons; 2024-2032)
|
|
|
- Sweden Price Tier (Revenue, USD Billion, Volume, Kilotons; 2024-2032)
|
|
|
- Sweden Can Size (Revenue, USD Billion, Volume, Kilotons; 2024-2032)
|
|
|
- Sweden Shelf-Life Band (Revenue, USD Billion, Volume, Kilotons; 2024-2032)
|
|
|
- Sweden Distribution Channel (Revenue, USD Billion, Volume, Kilotons; 2024-2032)
|
|
- Sweden End Use (Revenue, USD Billion, Volume, Kilotons; 2024-2032)
|
|
- Rest of Europe
- Rest of Europe Product Type Outlook (Revenue, USD Billion, Volume, Kilotons; 2024-2032)
|
|
|
|
|
|
|
|
|
|
|
- Rest of Europe Can Construction (Revenue, USD Billion, Volume, Kilotons; 2024-2032)
-
- Steel
-
- Aluminum
- Rest of Europe Can Construction Outlook (Revenue, USD Billion, Volume, Kilotons; 2024-2032)
-
- 2-piece DRD
-
- 3-piece welded
-
- 1-Piece (Seamless/Deep-drawn)
- Rest of Europe Ingredient Outlook (Revenue, USD Billion, Volume, Kilotons; 2024-2032)
|
|
|
- Rest of Europe Packaging Method (Revenue, USD Billion, Volume, Kilotons; 2024-2032)
|
|
|
- Rest of Europe Price Tier (Revenue, USD Billion, Volume, Kilotons; 2024-2032)
|
|
|
- Rest of Europe Can Size (Revenue, USD Billion, Volume, Kilotons; 2024-2032)
|
|
|
- Rest of Europe Shelf-Life Band (Revenue, USD Billion, Volume, Kilotons; 2024-2032)
|
|
|
- Rest of Europe Distribution Channel (Revenue, USD Billion, Volume, Kilotons; 2024-2032)
|
|
- Rest of Europe End Use (Revenue, USD Billion, Volume, Kilotons; 2024-2032)
|
|
- Asia-Pacific
- Asia Pacific Product Type Outlook (Revenue, USD Billion, Volume, Kilotons; 2024-2032)
|
|
|
|
|
|
|
|
|
|
|
- Asia Pacific Can Construction (Revenue, USD Billion, Volume, Kilotons; 2024-2032)
-
- Steel
-
- Aluminum
- Asia Pacific Can Construction Outlook (Revenue, USD Billion, Volume, Kilotons; 2024-2032)
-
- 2-piece DRD
-
- 3-piece welded
-
- 1-Piece (Seamless/Deep-drawn)
- Asia Pacific Ingredient Outlook (Revenue, USD Billion, Volume, Kilotons; 2024-2032)
|
|
|
- Asia Pacific Packaging Method (Revenue, USD Billion, Volume, Kilotons; 2024-2032)
|
|
|
- Asia Pacific Price Tier (Revenue, USD Billion, Volume, Kilotons; 2024-2032)
|
|
|
- Asia Pacific Can Size (Revenue, USD Billion, Volume, Kilotons; 2024-2032)
|
|
|
- Asia Pacific Shelf-Life Band (Revenue, USD Billion, Volume, Kilotons; 2024-2032)
|
|
|
- Asia Pacific Distribution Channel (Revenue, USD Billion, Volume, Kilotons; 2024-2032)
|
|
- Asia Pacific End Use (Revenue, USD Billion, Volume, Kilotons; 2024-2032)
|
|
- China
- China Product Type Outlook (Revenue, USD Billion, Volume, Kilotons; 2024-2032)
|
|
|
|
|
|
|
|
|
|
|
- China Can Construction (Revenue, USD Billion, Volume, Kilotons; 2024-2032)
-
- Steel
-
- Aluminum
- China Can Construction Outlook (Revenue, USD Billion, Volume, Kilotons; 2024-2032)
-
- 2-piece DRD
-
- 3-piece welded
-
- 1-Piece (Seamless/Deep-drawn)
- China Ingredient Outlook (Revenue, USD Billion, Volume, Kilotons; 2024-2032)
|
|
|
- China Packaging Method (Revenue, USD Billion, Volume, Kilotons; 2024-2032)
|
|
|
- China Price Tier (Revenue, USD Billion, Volume, Kilotons; 2024-2032)
|
|
|
- China Can Size (Revenue, USD Billion, Volume, Kilotons; 2024-2032)
|
|
|
- China Shelf-Life Band (Revenue, USD Billion, Volume, Kilotons; 2024-2032)
|
|
|
- China Distribution Channel (Revenue, USD Billion, Volume, Kilotons; 2024-2032)
|
|
- China End Use (Revenue, USD Billion, Volume, Kilotons; 2024-2032)
|
|
- India
- India Product Type Outlook (Revenue, USD Billion, Volume, Kilotons; 2024-2032)
|
|
|
|
|
|
|
|
|
|
|
- India Can Construction (Revenue, USD Billion, Volume, Kilotons; 2024-2032)
-
- Steel
-
- Aluminum
- India Can Construction Outlook (Revenue, USD Billion, Volume, Kilotons; 2024-2032)
-
- 2-piece DRD
-
- 3-piece welded
-
- 1-Piece (Seamless/Deep-drawn)
- India Ingredient Outlook (Revenue, USD Billion, Volume, Kilotons; 2024-2032)
|
|
|
- India Packaging Method (Revenue, USD Billion, Volume, Kilotons; 2024-2032)
|
|
|
- India Price Tier (Revenue, USD Billion, Volume, Kilotons; 2024-2032)
|
|
|
- India Can Size (Revenue, USD Billion, Volume, Kilotons; 2024-2032)
|
|
|
- India Shelf-Life Band (Revenue, USD Billion, Volume, Kilotons; 2024-2032)
|
|
|
- India Distribution Channel (Revenue, USD Billion, Volume, Kilotons; 2024-2032)
|
|
- India End Use (Revenue, USD Billion, Volume, Kilotons; 2024-2032)
|
|
- Japan
- Japan Product Type Outlook (Revenue, USD Billion, Volume, Kilotons; 2024-2032)
|
|
|
|
|
|
|
|
|
|
|
- Japan Can Construction (Revenue, USD Billion, Volume, Kilotons; 2024-2032)
-
- Steel
-
- Aluminum
- Japan Can Construction Outlook (Revenue, USD Billion, Volume, Kilotons; 2024-2032)
-
- 2-piece DRD
-
- 3-piece welded
-
- 1-Piece (Seamless/Deep-drawn)
- Japan Ingredient Outlook (Revenue, USD Billion, Volume, Kilotons; 2024-2032)
|
|
|
- Japan Packaging Method (Revenue, USD Billion, Volume, Kilotons; 2024-2032)
|
|
|
- Japan Price Tier (Revenue, USD Billion, Volume, Kilotons; 2024-2032)
|
|
|
- Japan Can Size (Revenue, USD Billion, Volume, Kilotons; 2024-2032)
|
|
|
- Japan Shelf-Life Band (Revenue, USD Billion, Volume, Kilotons; 2024-2032)
|
|
|
- Japan Distribution Channel (Revenue, USD Billion, Volume, Kilotons; 2024-2032)
|
|
- Japan End Use (Revenue, USD Billion, Volume, Kilotons; 2024-2032)
|
|
- South Korea
- South Korea Product Type Outlook (Revenue, USD Billion, Volume, Kilotons; 2024-2032)
|
|
|
|
|
|
|
|
|
|
|
- South Korea Can Construction (Revenue, USD Billion, Volume, Kilotons; 2024-2032)
-
- Steel
-
- Aluminum
- South Korea Can Construction Outlook (Revenue, USD Billion, Volume, Kilotons; 2024-2032)
-
- 2-piece DRD
-
- 3-piece welded
-
- 1-Piece (Seamless/Deep-drawn)
- South Korea Ingredient Outlook (Revenue, USD Billion, Volume, Kilotons; 2024-2032)
|
|
|
- South Korea Packaging Method (Revenue, USD Billion, Volume, Kilotons; 2024-2032)
|
|
|
- South Korea Price Tier (Revenue, USD Billion, Volume, Kilotons; 2024-2032)
|
|
|
- South Korea Can Size (Revenue, USD Billion, Volume, Kilotons; 2024-2032)
|
|
|
- South Korea Shelf-Life Band (Revenue, USD Billion, Volume, Kilotons; 2024-2032)
|
|
|
- South Korea Distribution Channel (Revenue, USD Billion, Volume, Kilotons; 2024-2032)
|
|
- South Korea End Use (Revenue, USD Billion, Volume, Kilotons; 2024-2032)
|
|
- Indonesia
- Indonesia Product Type Outlook (Revenue, USD Billion, Volume, Kilotons; 2024-2032)
|
|
|
|
|
|
|
|
|
|
|
- Indonesia Can Construction (Revenue, USD Billion, Volume, Kilotons; 2024-2032)
-
- Steel
-
- Aluminum
- Indonesia Can Construction Outlook (Revenue, USD Billion, Volume, Kilotons; 2024-2032)
-
- 2-piece DRD
-
- 3-piece welded
-
- 1-Piece (Seamless/Deep-drawn)
- Indonesia Ingredient Outlook (Revenue, USD Billion, Volume, Kilotons; 2024-2032)
|
|
|
- Indonesia Packaging Method (Revenue, USD Billion, Volume, Kilotons; 2024-2032)
|
|
|
- Indonesia Price Tier (Revenue, USD Billion, Volume, Kilotons; 2024-2032)
|
|
|
- Indonesia Can Size (Revenue, USD Billion, Volume, Kilotons; 2024-2032)
|
|
|
- Indonesia Shelf-Life Band (Revenue, USD Billion, Volume, Kilotons; 2024-2032)
|
|
|
- Indonesia Distribution Channel (Revenue, USD Billion, Volume, Kilotons; 2024-2032)
|
|
- Indonesia End Use (Revenue, USD Billion, Volume, Kilotons; 2024-2032)
|
|
- Thailand
- Thailand Product Type Outlook (Revenue, USD Billion, Volume, Kilotons; 2024-2032)
|
|
|
|
|
|
|
|
|
|
|
- Thailand Can Construction (Revenue, USD Billion, Volume, Kilotons; 2024-2032)
-
- Steel
-
- Aluminum
- Thailand Can Construction Outlook (Revenue, USD Billion, Volume, Kilotons; 2024-2032)
-
- 2-piece DRD
-
- 3-piece welded
-
- 1-Piece (Seamless/Deep-drawn)
- Thailand Ingredient Outlook (Revenue, USD Billion, Volume, Kilotons; 2024-2032)
|
|
|
- Thailand Packaging Method (Revenue, USD Billion, Volume, Kilotons; 2024-2032)
|
|
|
- Thailand Price Tier (Revenue, USD Billion, Volume, Kilotons; 2024-2032)
|
|
|
- Thailand Can Size (Revenue, USD Billion, Volume, Kilotons; 2024-2032)
|
|
|
- Thailand Shelf-Life Band (Revenue, USD Billion, Volume, Kilotons; 2024-2032)
|
|
|
- Thailand Distribution Channel (Revenue, USD Billion, Volume, Kilotons; 2024-2032)
|
|
- Thailand End Use (Revenue, USD Billion, Volume, Kilotons; 2024-2032)
|
|
- Vietnam
- Vietnam Product Type Outlook (Revenue, USD Billion, Volume, Kilotons; 2024-2032)
|
|
|
|
|
|
|
|
|
|
|
- Vietnam Can Construction (Revenue, USD Billion, Volume, Kilotons; 2024-2032)
-
- Steel
-
- Aluminum
- Vietnam Can Construction Outlook (Revenue, USD Billion, Volume, Kilotons; 2024-2032)
-
- 2-piece DRD
-
- 3-piece welded
-
- 1-Piece (Seamless/Deep-drawn)
- Vietnam Ingredient Outlook (Revenue, USD Billion, Volume, Kilotons; 2024-2032)
|
|
|
- Vietnam Packaging Method (Revenue, USD Billion, Volume, Kilotons; 2024-2032)
|
|
|
- Vietnam Price Tier (Revenue, USD Billion, Volume, Kilotons; 2024-2032)
|
|
|
- Vietnam Can Size (Revenue, USD Billion, Volume, Kilotons; 2024-2032)
|
|
|
- Vietnam Shelf-Life Band (Revenue, USD Billion, Volume, Kilotons; 2024-2032)
|
|
|
- Vietnam Distribution Channel (Revenue, USD Billion, Volume, Kilotons; 2024-2032)
|
|
- Vietnam End Use (Revenue, USD Billion, Volume, Kilotons; 2024-2032)
|
|
- Australia
- Australia Product Type Outlook (Revenue, USD Billion, Volume, Kilotons; 2024-2032)
|
|
|
|
|
|
|
|
|
|
|
- Australia Can Construction (Revenue, USD Billion, Volume, Kilotons; 2024-2032)
-
- Steel
-
- Aluminum
- Australia Can Construction Outlook (Revenue, USD Billion, Volume, Kilotons; 2024-2032)
-
- 2-piece DRD
-
- 3-piece welded
-
- 1-Piece (Seamless/Deep-drawn)
- Australia Ingredient Outlook (Revenue, USD Billion, Volume, Kilotons; 2024-2032)
|
|
|
- Australia Packaging Method (Revenue, USD Billion, Volume, Kilotons; 2024-2032)
|
|
|
- Australia Price Tier (Revenue, USD Billion, Volume, Kilotons; 2024-2032)
|
|
|
- Australia Can Size (Revenue, USD Billion, Volume, Kilotons; 2024-2032)
|
|
|
- Australia Shelf-Life Band (Revenue, USD Billion, Volume, Kilotons; 2024-2032)
|
|
|
- Australia Distribution Channel (Revenue, USD Billion, Volume, Kilotons; 2024-2032)
|
|
- Australia End Use (Revenue, USD Billion, Volume, Kilotons; 2024-2032)
|
|
- New Zeeland
- New Zeeland Product Type Outlook (Revenue, USD Billion, Volume, Kilotons; 2024-2032)
|
|
|
|
|
|
|
|
|
|
|
- New Zeeland Can Construction (Revenue, USD Billion, Volume, Kilotons; 2024-2032)
-
- Steel
-
- Aluminum
- New Zeeland Can Construction Outlook (Revenue, USD Billion, Volume, Kilotons; 2024-2032)
-
- 2-piece DRD
-
- 3-piece welded
-
- 1-Piece (Seamless/Deep-drawn)
- New Zeeland Ingredient Outlook (Revenue, USD Billion, Volume, Kilotons; 2024-2032)
|
|
|
- New Zeeland Packaging Method (Revenue, USD Billion, Volume, Kilotons; 2024-2032)
|
|
|
- New Zeeland Price Tier (Revenue, USD Billion, Volume, Kilotons; 2024-2032)
|
|
|
- New Zeeland Can Size (Revenue, USD Billion, Volume, Kilotons; 2024-2032)
|
|
|
- New Zeeland Shelf-Life Band (Revenue, USD Billion, Volume, Kilotons; 2024-2032)
|
|
|
- New Zeeland Distribution Channel (Revenue, USD Billion, Volume, Kilotons; 2024-2032)
|
|
- New Zeeland End Use (Revenue, USD Billion, Volume, Kilotons; 2024-2032)
|
|
- Rest of APAC
- Rest of APAC Product Type Outlook (Revenue, USD Billion, Volume, Kilotons; 2024-2032)
|
|
|
|
|
|
|
|
|
|
|
- Rest of APAC Can Construction (Revenue, USD Billion, Volume, Kilotons; 2024-2032)
-
- Steel
-
- Aluminum
- Rest of APAC Can Construction Outlook (Revenue, USD Billion, Volume, Kilotons; 2024-2032)
-
- 2-piece DRD
-
- 3-piece welded
-
- 1-Piece (Seamless/Deep-drawn)
- Rest of APAC Ingredient Outlook (Revenue, USD Billion, Volume, Kilotons; 2024-2032)
|
|
|
- Rest of APAC Packaging Method (Revenue, USD Billion, Volume, Kilotons; 2024-2032)
|
|
|
- Rest of APAC Price Tier (Revenue, USD Billion, Volume, Kilotons; 2024-2032)
|
|
|
- Rest of APAC Can Size (Revenue, USD Billion, Volume, Kilotons; 2024-2032)
|
|
|
- Rest of APAC Shelf-Life Band (Revenue, USD Billion, Volume, Kilotons; 2024-2032)
|
|
|
- Rest of APAC Distribution Channel (Revenue, USD Billion, Volume, Kilotons; 2024-2032)
|
|
- Rest of APAC End Use (Revenue, USD Billion, Volume, Kilotons; 2024-2032)
|
|
- Latin America
- Latin America Product Type Outlook (Revenue, USD Billion, Volume, Kilotons; 2024-2032)
|
|
|
|
|
|
|
|
|
|
|
- Latin America Can Construction (Revenue, USD Billion, Volume, Kilotons; 2024-2032)
-
- Steel
-
- Aluminum
- Latin America Can Construction Outlook (Revenue, USD Billion, Volume, Kilotons; 2024-2032)
-
- 2-piece DRD
-
- 3-piece welded
-
- 1-Piece (Seamless/Deep-drawn)
- Latin America Ingredient Outlook (Revenue, USD Billion, Volume, Kilotons; 2024-2032)
|
|
|
- Latin America Packaging Method (Revenue, USD Billion, Volume, Kilotons; 2024-2032)
|
|
|
- Latin America Price Tier (Revenue, USD Billion, Volume, Kilotons; 2024-2032)
|
|
|
- Latin America Can Size (Revenue, USD Billion, Volume, Kilotons; 2024-2032)
|
|
|
- Latin America Shelf-Life Band (Revenue, USD Billion, Volume, Kilotons; 2024-2032)
|
|
|
- Latin America Distribution Channel (Revenue, USD Billion, Volume, Kilotons; 2024-2032)
|
|
- Latin America End Use (Revenue, USD Billion, Volume, Kilotons; 2024-2032)
|
|
- Brazil
- Brazil Product Type Outlook (Revenue, USD Billion, Volume, Kilotons; 2024-2032)
|
|
|
|
|
|
|
|
|
|
|
- Brazil Can Construction (Revenue, USD Billion, Volume, Kilotons; 2024-2032)
-
- Steel
-
- Aluminum
- Brazil Can Construction Outlook (Revenue, USD Billion, Volume, Kilotons; 2024-2032)
-
- 2-piece DRD
-
- 3-piece welded
-
- 1-Piece (Seamless/Deep-drawn)
- Brazil Ingredient Outlook (Revenue, USD Billion, Volume, Kilotons; 2024-2032)
|
|
|
- Brazil Packaging Method (Revenue, USD Billion, Volume, Kilotons; 2024-2032)
|
|
|
- Brazil Price Tier (Revenue, USD Billion, Volume, Kilotons; 2024-2032)
|
|
|
- Brazil Can Size (Revenue, USD Billion, Volume, Kilotons; 2024-2032)
|
|
|
- Brazil Shelf-Life Band (Revenue, USD Billion, Volume, Kilotons; 2024-2032)
|
|
|
- Brazil Distribution Channel (Revenue, USD Billion, Volume, Kilotons; 2024-2032)
|
|
- Brazil End Use (Revenue, USD Billion, Volume, Kilotons; 2024-2032)
|
|
- Rest of LATAM
- Rest of LATAM Product Type Outlook (Revenue, USD Billion, Volume, Kilotons; 2024-2032)
|
|
|
|
|
|
|
|
|
|
|
- Rest of LATAM Can Construction (Revenue, USD Billion, Volume, Kilotons; 2024-2032)
-
- Steel
-
- Aluminum
- Rest of LATAM Can Construction Outlook (Revenue, USD Billion, Volume, Kilotons; 2024-2032)
-
- 2-piece DRD
-
- 3-piece welded
-
- 1-Piece (Seamless/Deep-drawn)
- Rest of LATAM Ingredient Outlook (Revenue, USD Billion, Volume, Kilotons; 2024-2032)
|
|
|
- Rest of LATAM Packaging Method (Revenue, USD Billion, Volume, Kilotons; 2024-2032)
|
|
|
- Rest of LATAM Price Tier (Revenue, USD Billion, Volume, Kilotons; 2024-2032)
|
|
|
- Rest of LATAM Can Size (Revenue, USD Billion, Volume, Kilotons; 2024-2032)
|
|
|
- Rest of LATAM Shelf-Life Band (Revenue, USD Billion, Volume, Kilotons; 2024-2032)
|
|
|
- Rest of LATAM Distribution Channel (Revenue, USD Billion, Volume, Kilotons; 2024-2032)
|
|
- Rest of LATAM End Use (Revenue, USD Billion, Volume, Kilotons; 2024-2032)
|
|
- Middle East & Africa
- Middle East & Africa Product Type Outlook (Revenue, USD Billion, Volume, Kilotons; 2024-2032)
|
|
|
|
|
|
|
|
|
|
|
- Middle East & Africa Can Construction (Revenue, USD Billion, Volume, Kilotons; 2024-2032)
-
- Steel
-
- Aluminum
- Middle East & Africa Can Construction Outlook (Revenue, USD Billion, Volume, Kilotons; 2024-2032)
-
- 2-piece DRD
-
- 3-piece welded
-
- 1-Piece (Seamless/Deep-drawn)
- Middle East & Africa Ingredient Outlook (Revenue, USD Billion, Volume, Kilotons; 2024-2032)
|
|
|
- Middle East & Africa Packaging Method (Revenue, USD Billion, Volume, Kilotons; 2024-2032)
|
|
|
- Middle East & Africa Price Tier (Revenue, USD Billion, Volume, Kilotons; 2024-2032)
|
|
|
- Middle East & Africa Can Size (Revenue, USD Billion, Volume, Kilotons; 2024-2032)
|
|
|
- Middle East & Africa Shelf-Life Band (Revenue, USD Billion, Volume, Kilotons; 2024-2032)
|
|
|
- Middle East & Africa Distribution Channel (Revenue, USD Billion, Volume, Kilotons; 2024-2032)
|
|
- Middle East & Africa End Use (Revenue, USD Billion, Volume, Kilotons; 2024-2032)
|
|
- Saudi Arabia
- Saudi Arabia Product Type Outlook (Revenue, USD Billion, Volume, Kilotons; 2024-2032)
|
|
|
|
|
|
|
|
|
|
|
- Saudi Arabia Can Construction (Revenue, USD Billion, Volume, Kilotons; 2024-2032)
-
- Steel
-
- Aluminum
- Saudi Arabia Can Construction Outlook (Revenue, USD Billion, Volume, Kilotons; 2024-2032)
-
- 2-piece DRD
-
- 3-piece welded
-
- 1-Piece (Seamless/Deep-drawn)
- Saudi Arabia Ingredient Outlook (Revenue, USD Billion, Volume, Kilotons; 2024-2032)
|
|
|
- Saudi Arabia Packaging Method (Revenue, USD Billion, Volume, Kilotons; 2024-2032)
|
|
|
- Saudi Arabia Price Tier (Revenue, USD Billion, Volume, Kilotons; 2024-2032)
|
|
|
- Saudi Arabia Can Size (Revenue, USD Billion, Volume, Kilotons; 2024-2032)
|
|
|
- Saudi Arabia Shelf-Life Band (Revenue, USD Billion, Volume, Kilotons; 2024-2032)
|
|
|
- Saudi Arabia Distribution Channel (Revenue, USD Billion, Volume, Kilotons; 2024-2032)
|
|
- Saudi Arabia End Use (Revenue, USD Billion, Volume, Kilotons; 2024-2032)
|
|
- UAE
- UAE Product Type Outlook (Revenue, USD Billion, Volume, Kilotons; 2024-2032)
|
|
|
|
|
|
|
|
|
|
|
- UAE Can Construction (Revenue, USD Billion, Volume, Kilotons; 2024-2032)
-
- Steel
-
- Aluminum
- UAE Can Construction Outlook (Revenue, USD Billion, Volume, Kilotons; 2024-2032)
-
- 2-piece DRD
-
- 3-piece welded
-
- 1-Piece (Seamless/Deep-drawn)
- UAE Ingredient Outlook (Revenue, USD Billion, Volume, Kilotons; 2024-2032)
|
|
|
- UAE Packaging Method (Revenue, USD Billion, Volume, Kilotons; 2024-2032)
|
|
|
- UAE Price Tier (Revenue, USD Billion, Volume, Kilotons; 2024-2032)
|
|
|
- UAE Can Size (Revenue, USD Billion, Volume, Kilotons; 2024-2032)
|
|
|
- UAE Shelf-Life Band (Revenue, USD Billion, Volume, Kilotons; 2024-2032)
|
|
|
- UAE Distribution Channel (Revenue, USD Billion, Volume, Kilotons; 2024-2032)
|
|
- UAE End Use (Revenue, USD Billion, Volume, Kilotons; 2024-2032)
|
|
- South Africa
- South Africa Product Type Outlook (Revenue, USD Billion, Volume, Kilotons; 2024-2032)
|
|
|
|
|
|
|
|
|
|
|
- South Africa Can Construction (Revenue, USD Billion, Volume, Kilotons; 2024-2032)
-
- Steel
-
- Aluminum
- South Africa Can Construction Outlook (Revenue, USD Billion, Volume, Kilotons; 2024-2032)
-
- 2-piece DRD
-
- 3-piece welded
-
- 1-Piece (Seamless/Deep-drawn)
- South Africa Ingredient Outlook (Revenue, USD Billion, Volume, Kilotons; 2024-2032)
|
|
|
- South Africa Packaging Method (Revenue, USD Billion, Volume, Kilotons; 2024-2032)
|
|
|
- South Africa Price Tier (Revenue, USD Billion, Volume, Kilotons; 2024-2032)
|
|
|
- South Africa Can Size (Revenue, USD Billion, Volume, Kilotons; 2024-2032)
|
|
|
- South Africa Shelf-Life Band (Revenue, USD Billion, Volume, Kilotons; 2024-2032)
|
|
|
- South Africa Distribution Channel (Revenue, USD Billion, Volume, Kilotons; 2024-2032)
|
|
- South Africa End Use (Revenue, USD Billion, Volume, Kilotons; 2024-2032)
|
|
- Rest of MEA
- Rest of MEA Product Type Outlook (Revenue, USD Billion, Volume, Kilotons; 2024-2032)
|
|
|
|
|
|
|
|
|
|
|
- Rest of MEA Can Construction (Revenue, USD Billion, Volume, Kilotons; 2024-2032)
-
- Steel
-
- Aluminum
- Rest of MEA Can Construction Outlook (Revenue, USD Billion, Volume, Kilotons; 2024-2032)
-
- 2-piece DRD
-
- 3-piece welded
-
- 1-Piece (Seamless/Deep-drawn)
- Rest of MEA Ingredient Outlook (Revenue, USD Billion, Volume, Kilotons; 2024-2032)
|
|
|
- Rest of MEA Packaging Method (Revenue, USD Billion, Volume, Kilotons; 2024-2032)
|
|
|
- Rest of MEA Price Tier (Revenue, USD Billion, Volume, Kilotons; 2024-2032)
|
|
|
- Rest of MEA Can Size (Revenue, USD Billion, Volume, Kilotons; 2024-2032)
|
|
|
- Rest of MEA Shelf-Life Band (Revenue, USD Billion, Volume, Kilotons; 2024-2032)
|
|
|
- Rest of MEA Distribution Channel (Revenue, USD Billion, Volume, Kilotons; 2024-2032)
|
|
- Rest of MEA End Use (Revenue, USD Billion, Volume, Kilotons; 2024-2032)
|
|